OPEN-SOURCE SCRIPT
Burst Power
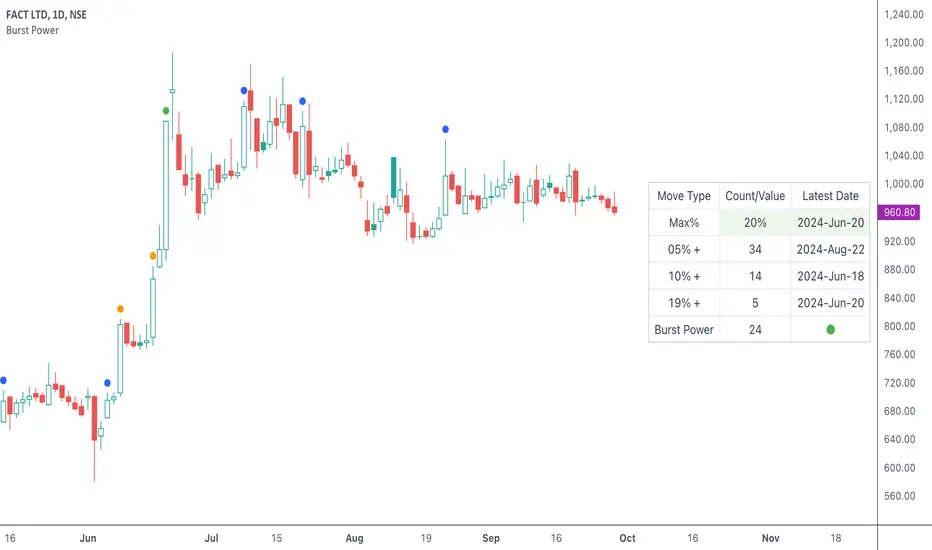
The Burst Power indicator is to be used for Indian markets where most stocks have a maximum price band limit of 20%.
This indicator is intended to identify stocks with high potential for significant price movements. By analysing historical price action over a user-defined lookback period, it calculates a Burst Power score that reflects the stock's propensity for rapid and substantial moves. This can be helpful for stock selection in strategies involving momentum bursts, swing trading, or identifying stocks with explosive potential.
Key Components
____________________
Significant Move Counts:
Maximum Price Move (%):
Burst Power Score:

Visual Indicators:

Using the Lookback Period
____________________________
The lookback period determines how much historical data the indicator analyses. Users can select from predefined options:
A shorter lookback period focuses on recent price action, which may be more relevant for short-term trading strategies. A longer lookback period provides a broader historical context, useful for identifying long-term patterns and behaviors.
Interpreting the Burst Power Score
__________________________________
High Burst Power Score (≥15):
Moderate Burst Power Score (10 to 14):
Low Burst Power Score (<10):
Note: Trading involves uncertainties, and the Burst Power score should be considered as one of many factors in a comprehensive trading strategy. It is essential to incorporate broader market analysis and risk management practices.
Customisation Options
_________________________
The indicator offers several customisation settings to tailor the display and functionality to individual preferences:

Display Mode:
Show Latest Date Column:
Theme (Dark Mode):
Table Position and Size:
Color Settings:

Bullish Closing Filter:
Another customisation here is to count a move only when the closing for the day is strong. For this, we have an additional filter to see if close is within the chosen % of the range of the day. Closing within the top 1/3, for instance, indicates a way more bullish day tha, say, closing within the bottom 25%.
Move Markers on chart:
The indicator also marks out days with significant moves. You can choose to hide or show the markers on the candles/bars.
Practical Applications
________________________
Disclaimer: Trading involves significant risk, and past performance is not indicative of future results. The Burst Power indicator is intended for educational purposes and should not be construed as financial advice. Always conduct thorough research and consult with a qualified financial professional before making investment decisions.
This indicator is intended to identify stocks with high potential for significant price movements. By analysing historical price action over a user-defined lookback period, it calculates a Burst Power score that reflects the stock's propensity for rapid and substantial moves. This can be helpful for stock selection in strategies involving momentum bursts, swing trading, or identifying stocks with explosive potential.
Key Components
____________________
Significant Move Counts:
- 5% Moves: Counts the number of days within the lookback period where the stock had a positive close-to-close move between 5% and 10%.
- 10% Moves: Counts the number of days with a positive close-to-close move between 10% and 19%.
- 19% Moves: Counts the number of days with a positive close-to-close move of 19% or more.
Maximum Price Move (%):
- Identifies the largest positive close-to-close percentage move within the lookback period, along with the date it occurred.
Burst Power Score:
- A composite score calculated using the counts of significant moves: Burst Power =(Count5%/5) +(Count10%/2) + (Count19%/0.5)
- The score is then rounded to the nearest whole number.
- A higher Burst Power score indicates a higher frequency of significant price bursts.
Visual Indicators:
- Table Display: Presents all the calculated data in a customisable table on the chart.
- Markers on Chart: Plots markers on the chart where significant moves occurred, aiding visual analysis.
Using the Lookback Period
____________________________
The lookback period determines how much historical data the indicator analyses. Users can select from predefined options:
- 3 Months
- 6 Months
- 1 Year
- 3 Years
- 5 Years
A shorter lookback period focuses on recent price action, which may be more relevant for short-term trading strategies. A longer lookback period provides a broader historical context, useful for identifying long-term patterns and behaviors.
Interpreting the Burst Power Score
__________________________________
High Burst Power Score (≥15):
- Indicates the stock frequently experiences significant price moves.
- Suitable for traders seeking quick momentum bursts and swing trading opportunities.
- Stocks with high scores may be more volatile but offer potential for rapid gains.
Moderate Burst Power Score (10 to 14):
- Suggests occasional significant price movements.
- May suit traders looking for a balance between volatility and stability.
Low Burst Power Score (<10):
- Reflects fewer significant price bursts.
- Stocks are more likely to exhibit longer, sustainable, but slower price trends.
- May be preferred by traders focusing on steady growth or longer-term investments.
Note: Trading involves uncertainties, and the Burst Power score should be considered as one of many factors in a comprehensive trading strategy. It is essential to incorporate broader market analysis and risk management practices.
Customisation Options
_________________________
The indicator offers several customisation settings to tailor the display and functionality to individual preferences:
Display Mode:
- Full Mode: Shows the detailed table with all components, including significant move counts, maximum price move, and the Burst Power score.
- Mini Mode: Displays only the Burst Power score and its corresponding indicator (green, orange, or red circle).
Show Latest Date Column:
- Toggle the display of the "Latest Date" column in the table, which shows the most recent occurrence of each significant move category.
Theme (Dark Mode):
- Switch between Dark Mode and Light Mode for better visual integration with your chart's color scheme.
Table Position and Size:
- Position: Place the table at various locations on the chart (top, middle, bottom; left, center, right).
- Size: Adjust the table's text size (tiny, small, normal, large, huge, auto) for optimal readability.
- Header Size: Customise the font size of the table headers (Small, Medium, Large).
Color Settings:
- Disable Colors in Table: Option to display the table without background colors, which can be useful for printing or if colors are distracting.
Bullish Closing Filter:
Another customisation here is to count a move only when the closing for the day is strong. For this, we have an additional filter to see if close is within the chosen % of the range of the day. Closing within the top 1/3, for instance, indicates a way more bullish day tha, say, closing within the bottom 25%.
Move Markers on chart:
The indicator also marks out days with significant moves. You can choose to hide or show the markers on the candles/bars.
Practical Applications
________________________
- Momentum Trading: High Burst Power scores can help identify stocks that are likely to experience rapid price movements, suitable for momentum traders.
- Swing Trading: Traders looking for short- to medium-term opportunities may focus on stocks with moderate to high Burst Power scores.
- Positional Trading: Lower Burst Power scores may indicate steadier stocks that are less prone to volatility, aligning with long-term investment strategies.
- Risk Management: Understanding a stock's propensity for significant moves can aid in setting appropriate stop-loss and take-profit levels.
Disclaimer: Trading involves significant risk, and past performance is not indicative of future results. The Burst Power indicator is intended for educational purposes and should not be construed as financial advice. Always conduct thorough research and consult with a qualified financial professional before making investment decisions.
Скрипт с открытым кодом
В истинном духе TradingView автор этого скрипта опубликовал его с открытым исходным кодом, чтобы трейдеры могли понять, как он работает, и проверить на практике. Вы можете воспользоваться им бесплатно, но повторное использование этого кода в публикации регулируется Правилами поведения. Вы можете добавить этот скрипт в избранное и использовать его на графике.
Отказ от ответственности
Все виды контента, которые вы можете увидеть на TradingView, не являются финансовыми, инвестиционными, торговыми или любыми другими рекомендациями. Мы не предоставляем советы по покупке и продаже активов. Подробнее — в Условиях использования TradingView.