Cumulative Volume Ratio v1.0
NYSE only.
0700am-1200pm only.
5 minute candles only.
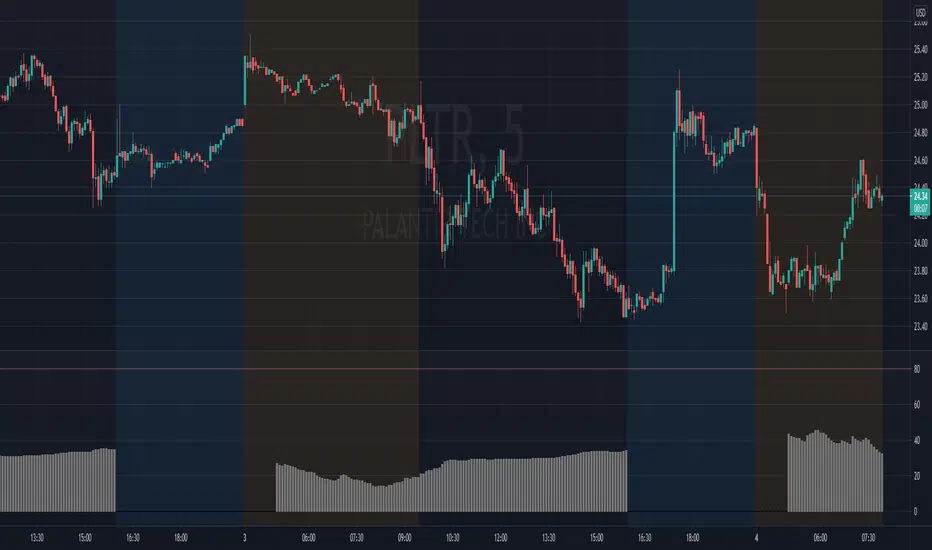
The code compares the cumulative volume of the current day to the 20 day cumulative average up to that same point in time.
This is commonly referenced as the Zanger Ratio.
The colors are based on the that version.
Below 60 = drying up (grey)
Above 60 = below average (orange)
Above 80 = average (pink)
Above 120 = High (magenta)
Above 200 = Extreme (red)
I purposely have these bars slightly transparent so we can quickly identify this indicator apart from my Specific Bar Volume Ratio or other bar based indicator.
This example is in Central time.
Contact me if you are interested.
There are two Inputs:
Shut Off Pre Market? , this helps visualization when the PM action is significantly higher than the opening action.
Disable Prior Days? , this helps visualization when the previous day's action is significantly higher than the current day's action.
If the 100SMA does not exist than the lookback period is cut to 10 days.
If the study has a max_bars_back study error ( ! ) ; switch the setting labeled such and the lookback will be cut to 5 days.
These changes are important when trading relatively new stocks. The code scans every 5 minute bar from 0400 EST to 1600 EST. When there is not steady liquidity the code fails because there is too much missing data.
The code will now reference the 20MA cumulative ratio unless there is not enough data (ticker has not been trading for at least 20 days).
If there is less than 20 days and more than 10 days, it will reference the 10MA.
If there is less than 10 days of trading, the plot will be zero.
Скрипт с ограниченным доступом
Доступ к этому скрипту разрешён только для пользователей, авторизованных автором, и для этого обычно требуется оплата. Вы можете добавить скрипт в список избранных, но использовать его можно будет только после запроса на доступ и получения разрешения от автора. Свяжитесь с kmack282, чтобы узнать больше, или следуйте инструкциям автора ниже.
Обратите внимание, что это приватный скрипт с ограниченным доступом, который модераторы скриптов не проверяли, поэтому ещё не установлено, насколько он соответствует Правилам поведения. TradingView не советует платить за скрипт и использовать его, если вы на 100% не доверяете его автору и не понимаете, как он работает. Часто вы можете найти хорошую альтернативу с открытым исходным кодом бесплатно в нашем разделе Скрипты сообщества.