OPEN-SOURCE SCRIPT
Aroon Single Line
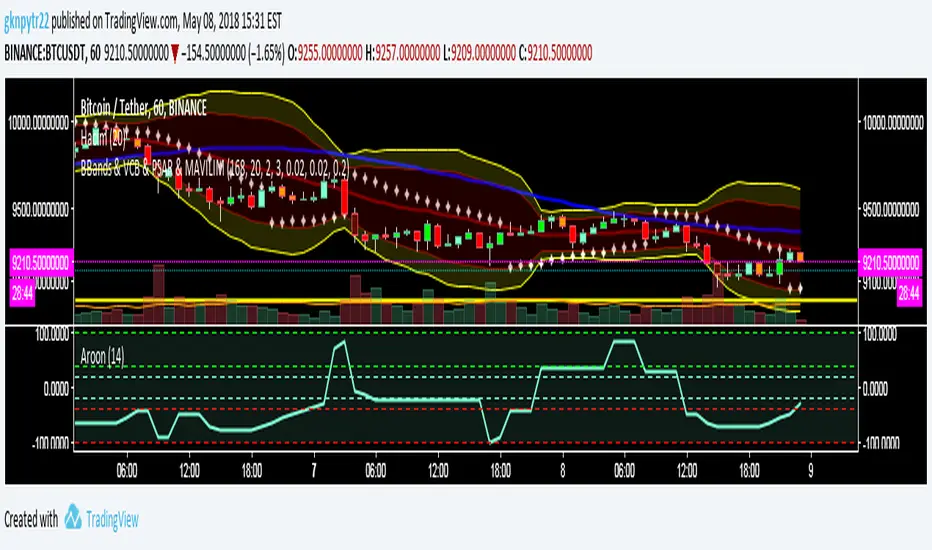
This indicator converts double lined Aroon indicator into a single line oscillator.
It is simply obtained by subtracting Aroon down from Aroon Up.
*If Oscillator points 100 value, it means there is a Strong Uptrend.
*If Oscillator points values between 100 and 40, it means there is an uptrend.
*If Oscillator points values between 20 and -20, it means no trend, it is sideways.But, when it is sideways; generally, oscillator makes FLAT LINES
between 20 and -20 values. 0 value is pointed out when the trend is downward as well, which means aroon up=aroon down.
*If Oscillator points values between -40 and -100, it means there is a downtrend.
*If Oscillator points -100 value, it means there is a Strong downtrend.
(20, 40) and (-20, -40) intervals are not mentioned, because; generally these are transition values and hard to comment, it will be more certain to
wait till values are between or at the reference values given.
Скрипт с открытым кодом
В истинном духе TradingView автор этого скрипта опубликовал его с открытым исходным кодом, чтобы трейдеры могли понять, как он работает, и проверить на практике. Вы можете воспользоваться им бесплатно, но повторное использование этого кода в публикации регулируется Правилами поведения. Вы можете добавить этот скрипт в избранное и использовать его на графике.
Отказ от ответственности
Все виды контента, которые вы можете увидеть на TradingView, не являются финансовыми, инвестиционными, торговыми или любыми другими рекомендациями. Мы не предоставляем советы по покупке и продаже активов. Подробнее — в Условиях использования TradingView.