OPEN-SOURCE SCRIPT
75: Notable Financial Crises
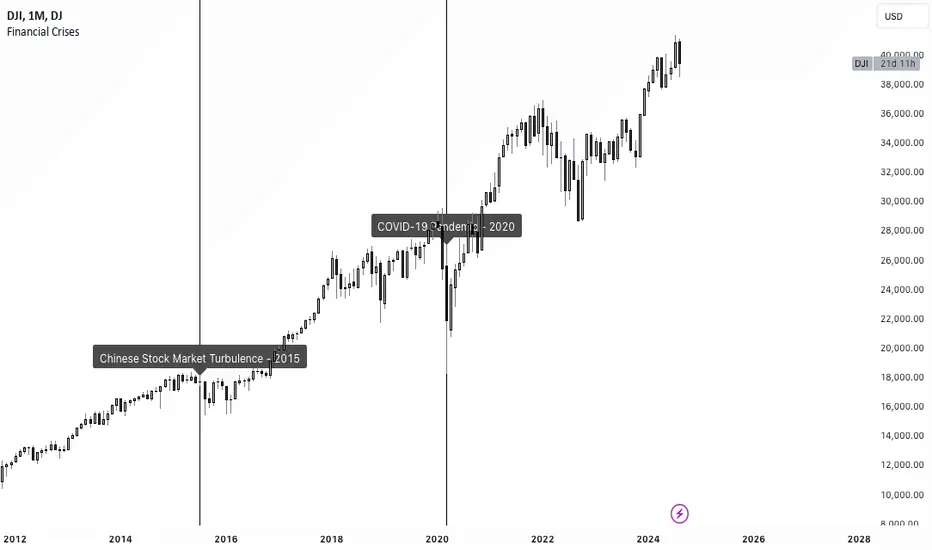
The TradingView script named "75: Notable Financial Crises" visualizes and marks significant financial crises on a financial chart.
This script plots vertical lines on the a chart corresponding to specific dates associated with notable financial crises in history. These crises could include events like the Great Depression (1929), Black Monday (1987), the Dot-com Bubble (2000), the Global Financial Crisis (2008), and others. By marking these dates on a chart, traders and analysts can easily observe the impact of these events on market behavior.
This script plots vertical lines on the a chart corresponding to specific dates associated with notable financial crises in history. These crises could include events like the Great Depression (1929), Black Monday (1987), the Dot-com Bubble (2000), the Global Financial Crisis (2008), and others. By marking these dates on a chart, traders and analysts can easily observe the impact of these events on market behavior.
Скрипт с открытым кодом
В истинном духе TradingView автор этого скрипта опубликовал его с открытым исходным кодом, чтобы трейдеры могли понять, как он работает, и проверить на практике. Вы можете воспользоваться им бесплатно, но повторное использование этого кода в публикации регулируется Правилами поведения. Вы можете добавить этот скрипт в избранное и использовать его на графике.
Отказ от ответственности
Все виды контента, которые вы можете увидеть на TradingView, не являются финансовыми, инвестиционными, торговыми или любыми другими рекомендациями. Мы не предоставляем советы по покупке и продаже активов. Подробнее — в Условиях использования TradingView.