PROTECTED SOURCE SCRIPT
BankNifty ticks
Обновлено
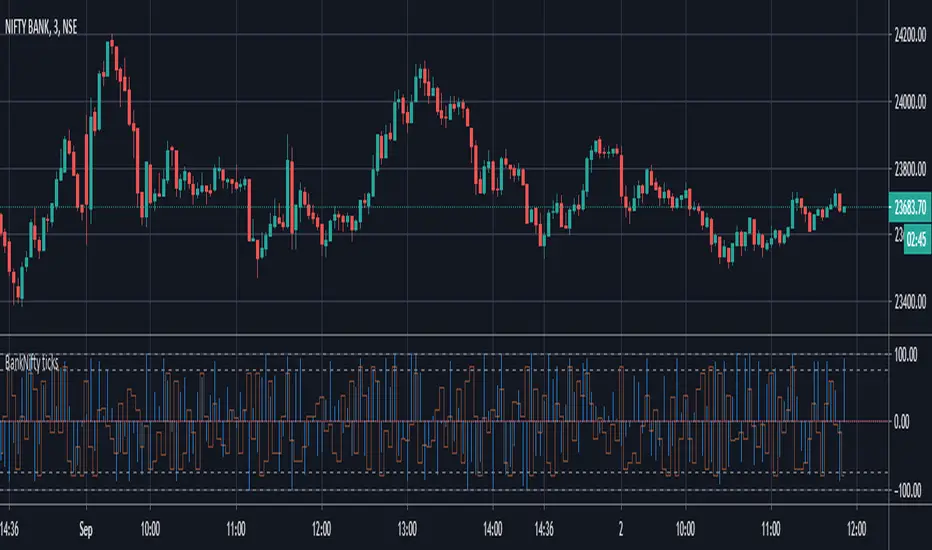
This is an attempt to create a leading indicator for BankNifty movement.
Here I combine Banknifty stocks and indices to create a Tick chart.
A Tick Chart - By definition, a Tick Chart tracks movement of the underlying stocks. A positive move is counted as +1 and negative move is counted as -1. Total for the underlying stocks is shown as tick chart.
BUT - Some stocks like HDFC Bank have much larger influence on the BankNifty index. So I have give weights to the stocks to calculate the index. Movement in other indices like Nifty also has influence of Banknifty next move. Hence I have combined a few indices in the calculation.
How to use this chart:
Reversals: One can look for strong tick movement in reverse direction of current trend - preceded by weak ticks.
Continuation Confirmation: Average tick movement in the positive or negative territory can confirm the positive or negative momentum respectively.
Further Notes:
I have also observed that before some reversals, tick value jumps to extreme. e.g. chart is showing minor uptrend. So we are getting Ticks in positive territory .. and there is a sudden extreme uptick..and then Banknifty turns down.
Nothing is perfect. So, even this indicator doesn't give you exact signals. Please take every indication / signal to strengthen your price action analysis.
Информация о релизе
Added "Volume Ticks". I really don't know or haven't explored if any such concept is used generally. In terms of coding, it is a similar concept; so I have just added it for the heck of it. I am finding it useful as well on short timeframe for day trading.If volume of a Banknifty stock is higher than previous candle, it is counted as +1. If it is lower, it is counted as -1. These counts are added to give the Banknifty Ticks count.
I try to use it for confirmation of reversal points as well potential support / resistance points on a short timeframe.
Another change done: the SMA of the regular ticks is hidden by default. Eversince I started using Volume ticks, I have found myself not using the SMA. Also, after adding Volume ticks, the chart got too crowded.
Отказ от ответственности
Все виды контента, которые вы можете увидеть на TradingView, не являются финансовыми, инвестиционными, торговыми или любыми другими рекомендациями. Мы не предоставляем советы по покупке и продаже активов. Подробнее — в Условиях использования TradingView.