PROTECTED SOURCE SCRIPT
ATOM Bollinger
Обновлено
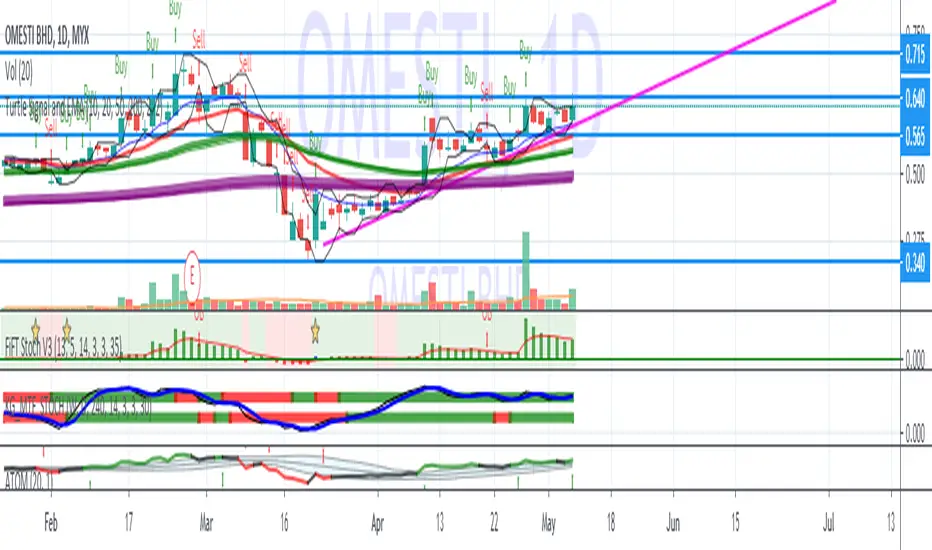
This is Bollinger band indicator. Default value is set at length 20 with 1 Standard Deviation (Narrow)
Upper and Lower Band is filled with blue color to indicate volatility of price movement
Line chart is represent price movement. Decision to buy/sell is as following :-
1 - Potential Buy - Price Line turned Green crossed above upper Band.
2 - Potential Sell - Price Line turned Red crossed below lower Band.
Note : Price breakout from narrow band normally result in rally.
The longer duration of narrow band will result in stronger rally after breakout
Note : Best use with "EMA Indicators with BUY sell Signal"
Информация о релизе
Add small detail mid bandContact me to learn Turtle Trading System, MCDX and other indicators (t.me/SgxFx)
tradingview.com/script/mbiUr95n-MCDX-Plus/
tradingview.com/script/mcAidXIT-FiFT-Pro/
tradingview.com/script/viAR3Ilo-Trend-Sign
tradingview.com/script/mbiUr95n-MCDX-Plus/
tradingview.com/script/mcAidXIT-FiFT-Pro/
tradingview.com/script/viAR3Ilo-Trend-Sign
Отказ от ответственности
Все виды контента, которые вы можете увидеть на TradingView, не являются финансовыми, инвестиционными, торговыми или любыми другими рекомендациями. Мы не предоставляем советы по покупке и продаже активов. Подробнее — в Условиях использования TradingView.