PROTECTED SOURCE SCRIPT
Vol%MA
Обновлено
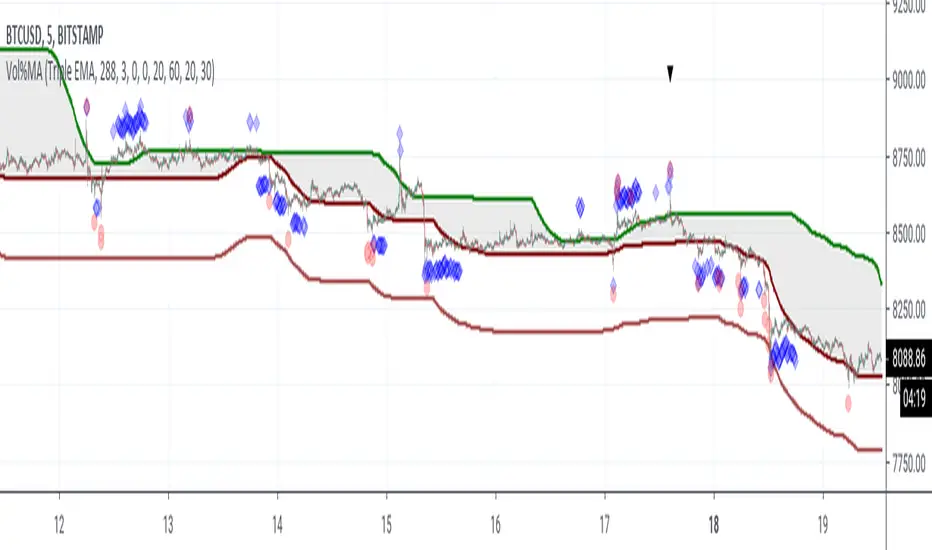
This study finds buying/selling opportunities on the basis of candlestick and volume percentage changes, prequalified by momentum.
Candlestick percentage changes that are equal to or greater the desired percentage with the momentum range are marked by blue diamonds.
Volume percentage changes that are equal to or greater the desired percentage with the momentum range are marked by red circles.
When candlestick and volume percentage changes aligned with user configurations are under momentum, a buy signal is triggered with BUY ASSET and a black triangle is placed at the bottom of the chart.
When candlestick and volume percentage changes aligned with user configurations are above momentum, a sell signal is triggered with SELL ASSET and a black triangle is placed at the top of the chart.
Информация о релизе
Harden against possible divide by/with 0 situations that would cause runaway alerts.Added settings to allow for configurable moving average choices for momentum.
Moving average choices for momentum are now: SMA, EMA, Double EMA, Triple EMA, Hull, Double Hull, Triple Hull
Информация о релизе
Updated moving average types:SMA, Double SMA, Triple SMA
EMA, Double EMA, Triple EMA
WMA, Double WMA, Triple WMA
VWMA, Double VWMA, Triple VWMA
Hull, Double Hull, Triple Hull
Информация о релизе
Major update! By carefully tuning this study, you can now "dial in" your profits.Candlestick percent change is now price percent change per candlestick.
There are now a total of 18 moving averages.
Price percent floor can be disabled.
Buying/selling can now be limited to a very specific price range.
Price/Volume percent changes can now be disabled for buying/selling independent of each other.
Информация о релизе
Fixed visual error with volume and price markers showing on candlesticks below the floor percentage.Join my Patreon for exclusive access to Jackrabbit TV,
patreon.com/RD3277
patreon.com/RD3277
Отказ от ответственности
Все виды контента, которые вы можете увидеть на TradingView, не являются финансовыми, инвестиционными, торговыми или любыми другими рекомендациями. Мы не предоставляем советы по покупке и продаже активов. Подробнее — в Условиях использования TradingView.