PROTECTED SOURCE SCRIPT
Intraday 5 Day Moving Average for Swing Trader
Обновлено
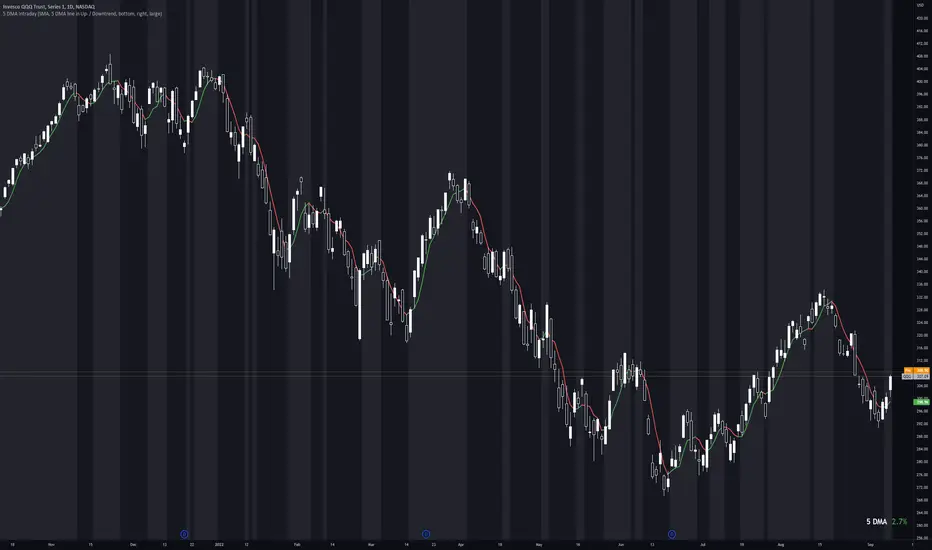
This indicator helps swing trader to quickly see if a stock or an index is in a short term up- or downtrend.
The 5 Day Moving Average line is shown on all intraday timeframes like 5, 10, 15, 30, 60, 65 and so on.
When an index like SPY or QQQ shows a green 5 DMA line, the index is in a short term uptrend and you can buy stocks for a swing trade,
when the line turns red be careful and stop buying stocks, instead watch out to short stocks.
In addition to the 5 DMA line you can show the percent distance to the 5 DMA and have multiple options to customize the indicator.
Features
■ Use SMA or EMA for the 5 DMA
■ Use different intraday timeframes or show on daily
■ Show the distance in percent
■ Different color modes
■ Multiple customize options
Информация о релизе
Add option to show a background color when the 5 DMA is uptrending or downtrending.Отказ от ответственности
Все виды контента, которые вы можете увидеть на TradingView, не являются финансовыми, инвестиционными, торговыми или любыми другими рекомендациями. Мы не предоставляем советы по покупке и продаже активов. Подробнее — в Условиях использования TradingView.