OPEN-SOURCE SCRIPT
Correlation Table by VanHelsing
Обновлено
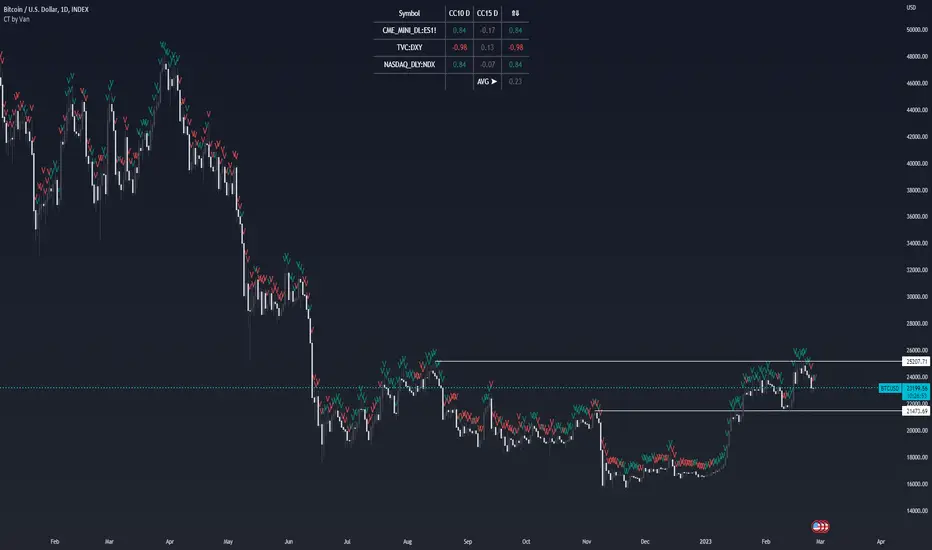
Correlation Table by VanHelsing
Explanation:
So we have three asset with correlation to current asset which is a BTC, also you can use it for ETH
But why only three assets? Because this one fits the best to identify a trend of BTC.
By using let's say a GOLD this table will be far away from accuracy then this three Nasdaq, ES1!(S&P500), DXY the best one for this.
Inside a script we have kama's
(Developed by Perry Kaufman, Kaufman's Adaptive Moving Average (KAMA) is a moving average designed to account for market noise or volatility. KAMA will closely follow prices when the price swings are relatively small and the noise is low. KAMA will adjust when the price swings widen and follow prices from a greater distance. This trend-following indicator can be used to identify the overall trend, time turning points and filter price movements.)
Now you know that KAMA is good solution for fast reaction of trend change and following it.
Now we have three assets with correlation to BTC and three kama's for them to know which trend is there.
Good!
What next?
Next is a scoring for up trend and down trend for BTC
For Understanding I will use DXY and BTC correlation
Lets consider that DXY is moving down and kama detected it,
we have down trend on DXY. How we can score it for BTC buy or sell?
Down trend DXY and negaive correlation to BTC lets say -0.5
In this way it scoring it like 0.5 for buy BTC, because if DXY moving down it means BTC moving up because of negative correlation.
Lets say DXY moving up and correlation with BTC is again -0.5
then what? It scoring -0.5 for sell BTC because since DXY moves up and correlation is negative BTC should move down.
Okay again what if DXY moving up and correlation is positive 0.5?
Then BTC is 0.5 for buy
What if DXY down correlation 0.5? Then BTC score for sell is -0.5
In first look it seems litle bit complicated, but actually it is not, it just take a time for understand. Hope you Enjoy this lesson and hope you will enjoy this indicator!
How to read a table:

Describtion about minimalistic mode

Explanation:
So we have three asset with correlation to current asset which is a BTC, also you can use it for ETH
But why only three assets? Because this one fits the best to identify a trend of BTC.
By using let's say a GOLD this table will be far away from accuracy then this three Nasdaq, ES1!(S&P500), DXY the best one for this.
Inside a script we have kama's
(Developed by Perry Kaufman, Kaufman's Adaptive Moving Average (KAMA) is a moving average designed to account for market noise or volatility. KAMA will closely follow prices when the price swings are relatively small and the noise is low. KAMA will adjust when the price swings widen and follow prices from a greater distance. This trend-following indicator can be used to identify the overall trend, time turning points and filter price movements.)
Now you know that KAMA is good solution for fast reaction of trend change and following it.
Now we have three assets with correlation to BTC and three kama's for them to know which trend is there.
Good!
What next?
Next is a scoring for up trend and down trend for BTC
For Understanding I will use DXY and BTC correlation
Lets consider that DXY is moving down and kama detected it,
we have down trend on DXY. How we can score it for BTC buy or sell?
Down trend DXY and negaive correlation to BTC lets say -0.5
In this way it scoring it like 0.5 for buy BTC, because if DXY moving down it means BTC moving up because of negative correlation.
Lets say DXY moving up and correlation with BTC is again -0.5
then what? It scoring -0.5 for sell BTC because since DXY moves up and correlation is negative BTC should move down.
Okay again what if DXY moving up and correlation is positive 0.5?
Then BTC is 0.5 for buy
What if DXY down correlation 0.5? Then BTC score for sell is -0.5
In first look it seems litle bit complicated, but actually it is not, it just take a time for understand. Hope you Enjoy this lesson and hope you will enjoy this indicator!
How to read a table:
Describtion about minimalistic mode
Информация о релизе
Added two periods to normal mode tableИнформация о релизе
-Информация о релизе
appearanceСкрипт с открытым кодом
В истинном духе TradingView автор этого скрипта опубликовал его с открытым исходным кодом, чтобы трейдеры могли понять, как он работает, и проверить на практике. Вы можете воспользоваться им бесплатно, но повторное использование этого кода в публикации регулируется Правилами поведения. Вы можете добавить этот скрипт в избранное и использовать его на графике.
Отказ от ответственности
Все виды контента, которые вы можете увидеть на TradingView, не являются финансовыми, инвестиционными, торговыми или любыми другими рекомендациями. Мы не предоставляем советы по покупке и продаже активов. Подробнее — в Условиях использования TradingView.