OPEN-SOURCE SCRIPT
Pivot Pattern Boundaries [cajole]
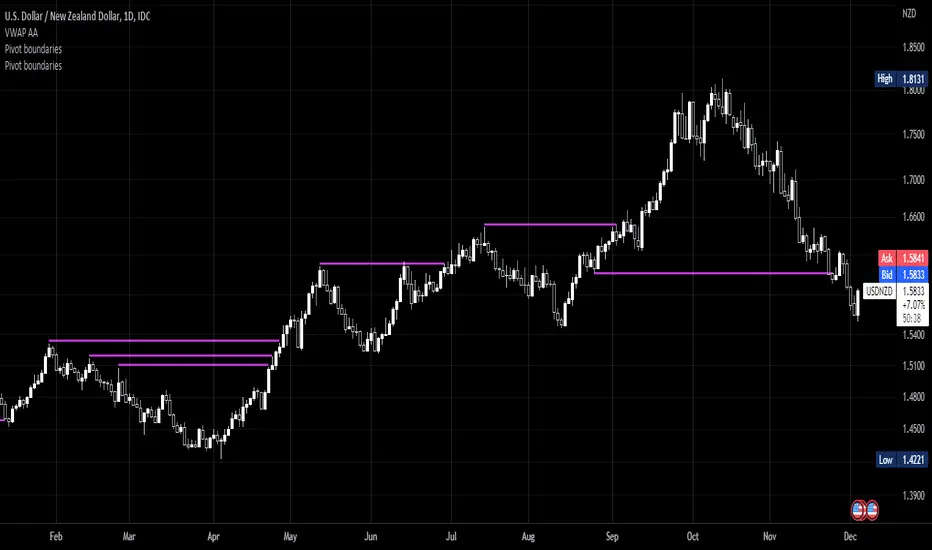
- This script automatically detects horizontal support / resistance levels based on user-programmable criteria.
- For example, you can detect boundaries with >3 touches within 200 days, allowing a tolerance of 1/4*ATR.
- "Touches" are defined from pivots on the chart. The best way to search for larger/smaller patterns is to increase/decrease the pivot size.*
- Future versions will allow "exceptions (i.e. keep drawing the horizontal line even if it is breached once or twice).
*TradingView's Pine script defines a Pivot as the highest point in a group. So, entering "2" means that a day's high needs to be above 2 days before and after (xxYxx) to be considered a high pivot.
This script can be an aid in drawing multiple patterns with horizontal boundaries (rectangles, triangles, head and shoulders, cup & handles, VCPs). I have intentionally avoided trying to code detection of the "other side" of these patterns, as that is where the craft of charting becomes an art.
Скрипт с открытым кодом
В истинном духе TradingView автор этого скрипта опубликовал его с открытым исходным кодом, чтобы трейдеры могли понять, как он работает, и проверить на практике. Вы можете воспользоваться им бесплатно, но повторное использование этого кода в публикации регулируется Правилами поведения. Вы можете добавить этот скрипт в избранное и использовать его на графике.
Отказ от ответственности
Все виды контента, которые вы можете увидеть на TradingView, не являются финансовыми, инвестиционными, торговыми или любыми другими рекомендациями. Мы не предоставляем советы по покупке и продаже активов. Подробнее — в Условиях использования TradingView.