PROTECTED SOURCE SCRIPT
High/Low of Day/Week
Обновлено
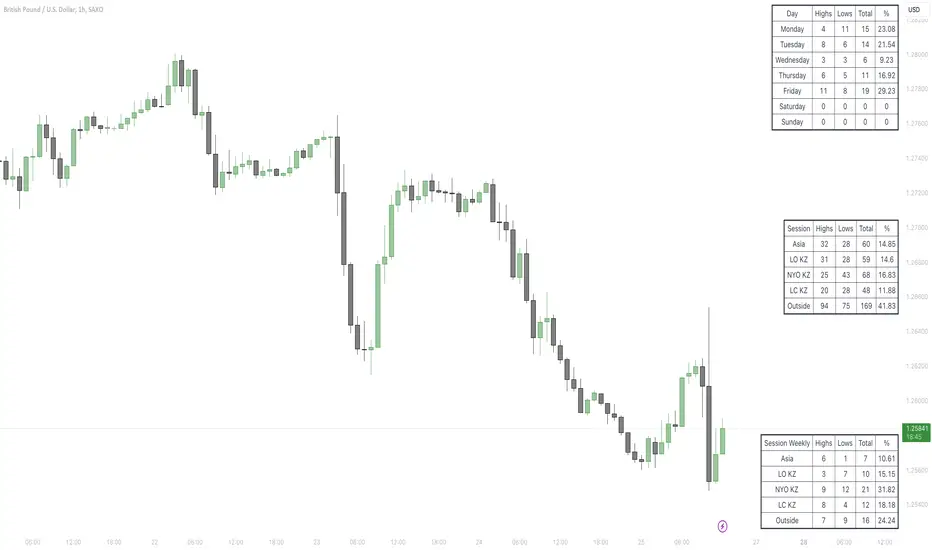
Displays stats collected from the configured start date and shows them in a table. In the first version, this shows the following distributions:
For the default settings (which contains the ICT Asian range and Kill zones), it's best used in 1-hour chart. If you're modifying the sessions, then make sure you use it on a timeframe which can fit all the enabled sessions. For example, if one of your sessions is 2-hour, but you're switching to a 4-hour chart, then the stats will contain errors and isn't reliable.
- High/Low of the week formed during days (top right table)
- High/Low of the day formed during configured sessions (middle right table)
- High/Low of the week formed during configured sessions (bottom right table)
For the default settings (which contains the ICT Asian range and Kill zones), it's best used in 1-hour chart. If you're modifying the sessions, then make sure you use it on a timeframe which can fit all the enabled sessions. For example, if one of your sessions is 2-hour, but you're switching to a 4-hour chart, then the stats will contain errors and isn't reliable.
Информация о релизе
Fix bug on including Friday and support setting table colorИнформация о релизе
Get rid of debug colors and support setting daily open (which also affects weekly opens)Информация о релизе
Update chartIf I've helped you somehow and you'd like to buy me a coffee, then here's my Tron (TRC20) address:
TL4nVSzFKqcuDE9uxPYZmizp2RdEUZseK8
TL4nVSzFKqcuDE9uxPYZmizp2RdEUZseK8
Отказ от ответственности
Все виды контента, которые вы можете увидеть на TradingView, не являются финансовыми, инвестиционными, торговыми или любыми другими рекомендациями. Мы не предоставляем советы по покупке и продаже активов. Подробнее — в Условиях использования TradingView.