PROTECTED SOURCE SCRIPT
Fibonacci Egosiesta
Обновлено
Description:
The EMA Fibonacci Retracement Strategy combines Exponential Moving Averages (EMA) with Fibonacci retracement levels to generate buy and sell signals. This strategy identifies potential entry points based on EMA crossovers and Fibonacci retracement levels, allowing traders to capitalize on trend reversals and retracements. Key features include:
EMA crossovers for trend identification
Customizable Fibonacci retracement levels for precise entry points
Adjustable take profit levels (TP1, TP2, TP3)
Suitable for both long and short positions
This strategy is ideal for traders looking to enhance their technical analysis with a robust and reliable trading system. Try it out and optimize your trading performance!
Информация о релизе
Fibonacci Retracement Finder with Extended Levels and Wick OptionDescription:
This script calculates and plots Fibonacci retracement levels between the highest and lowest prices over a user-defined or automatically calculated number of bars. Users can choose whether to use the closing price or the wick (high/low) price for calculations.
Features:
Automatic Bar Count: Automatically sets the number of bars based on the selected timeframe:
Daily and 4-hour charts: 1200 bars
1-hour and 30-minute charts: 1000 bars
15-minute charts: 1500 bars
10-minute charts: 2000 bars
5-minute charts: 2500 bars
1-minute charts: 2000 bars
Manual Bar Count: Option to manually input the number of bars for custom calculations.
Price Selection: Option to use either the closing price or the wick price (high/low) for determining the highest and lowest points.
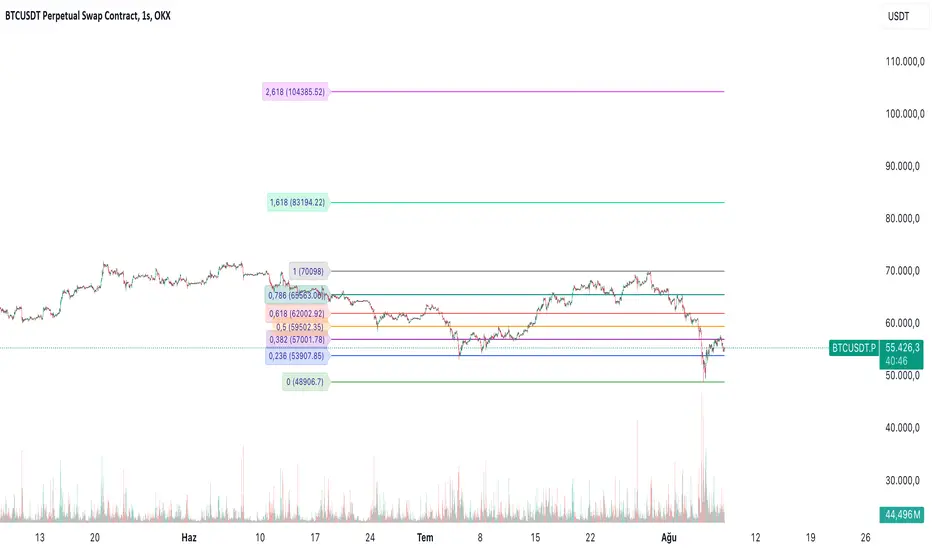
Fibonacci Levels: Plots Fibonacci retracement levels including extended levels (-0.618, 1.618, 2.618).
Labels: Displays Fibonacci levels with prices on the left side of the chart.
How to Use:
Choose between automatic and manual bar count in the settings.
If using manual bar count, input the desired number of bars.
Select whether to use closing prices or wick prices for the highest and lowest points.
The script will automatically plot the Fibonacci levels and display the prices.
This script is useful for identifying potential support and resistance levels based on historical price movements. The extended Fibonacci levels can also help in predicting future price movements.
Note:
Ensure that you are viewing the appropriate timeframe on your chart to match the automatic bar count settings for accurate calculations.
Информация о релизе
Change Name VersionИнформация о релизе
Fix ErrorИнформация о релизе
Update fixОтказ от ответственности
Все виды контента, которые вы можете увидеть на TradingView, не являются финансовыми, инвестиционными, торговыми или любыми другими рекомендациями. Мы не предоставляем советы по покупке и продаже активов. Подробнее — в Условиях использования TradingView.