OPEN-SOURCE SCRIPT
[GTH] Revenue
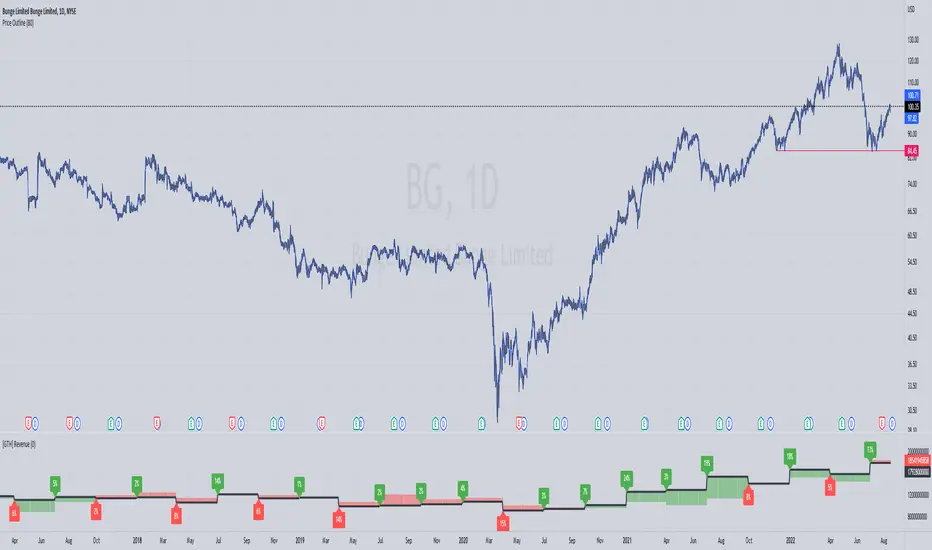
Visually similar to the GTH Earnings indicator, this indicator plots
Note 1: Although in Tradingview the 'E' tags on the time line display Revenues alongside with Earnings , there is a difference in timing. Revenues are reported quarterly; Earnings reporting dates differ with each stock. Hence, the tags in this indicator are not necessarily aligned with the Earnings reporting dates.
Note 2: It should be obvious that this indicator can only report data provided by Tradingview. Even more obviousy, it can not display revenues of anything else but stocks.
If you find a malfunction, please provide examples. "Does not work" is not helpful.
- Reported Revenue (black line)
- Difference to Estimated Revenue (colored bars)
- Percentage change to the previous Reported Revenue (tags)
Note 1: Although in Tradingview the 'E' tags on the time line display Revenues alongside with Earnings , there is a difference in timing. Revenues are reported quarterly; Earnings reporting dates differ with each stock. Hence, the tags in this indicator are not necessarily aligned with the Earnings reporting dates.
Note 2: It should be obvious that this indicator can only report data provided by Tradingview. Even more obviousy, it can not display revenues of anything else but stocks.
If you find a malfunction, please provide examples. "Does not work" is not helpful.
Скрипт с открытым кодом
В истинном духе TradingView автор этого скрипта опубликовал его с открытым исходным кодом, чтобы трейдеры могли понять, как он работает, и проверить на практике. Вы можете воспользоваться им бесплатно, но повторное использование этого кода в публикации регулируется Правилами поведения. Вы можете добавить этот скрипт в избранное и использовать его на графике.
Отказ от ответственности
Все виды контента, которые вы можете увидеть на TradingView, не являются финансовыми, инвестиционными, торговыми или любыми другими рекомендациями. Мы не предоставляем советы по покупке и продаже активов. Подробнее — в Условиях использования TradingView.