PROTECTED SOURCE SCRIPT
Bull Bear Zones for Bank Nifty and Nifty Index
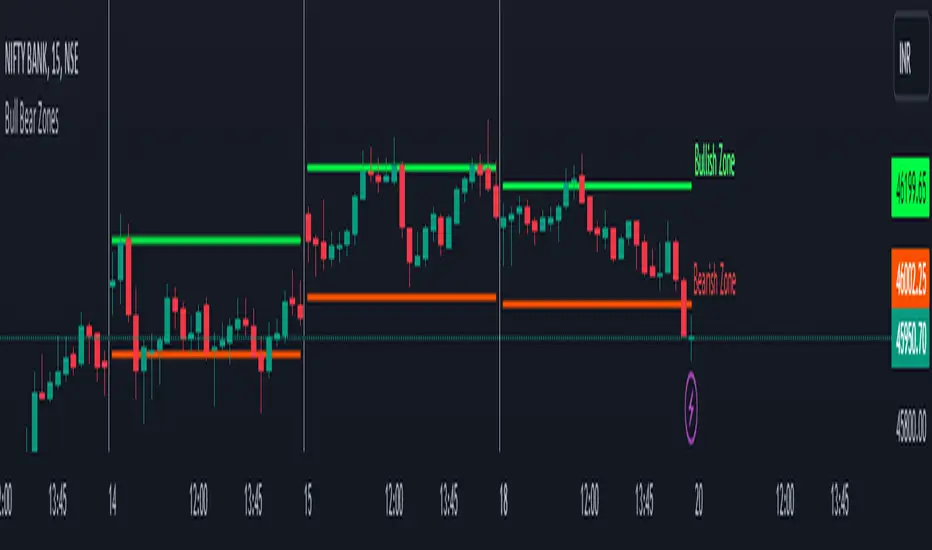
This indicator will automatically plot daily Bullish and Bearish Zones. Also this indicator mainly works in the Nifty and Bank Nifty Intraday trades. Preferred time frames (3/5/15 Mins)
Calculation
Take Last 5 days O H L C then find H-O and H-L, take average of the difference of H-O and H-L then Minimum Value then the average difference is added with the day opening to get the bullish zone and the average is subtracted from the opening price to get the bearish zone
Long Trade
Buy above the bullish zone line or Buy near the bearish support levels when it takes support
Example 1 (Buy above Bullish Zone)

Short Trade
Sell below the bearish zone line or Sell when there is a rejection from the bullish zone
Example 1 (Sell Below Bearish Zone)

No Trade Zone
If the market move between the zones then, the momentum is very week.
Example 1

Calculation
Take Last 5 days O H L C then find H-O and H-L, take average of the difference of H-O and H-L then Minimum Value then the average difference is added with the day opening to get the bullish zone and the average is subtracted from the opening price to get the bearish zone
Long Trade
Buy above the bullish zone line or Buy near the bearish support levels when it takes support
Example 1 (Buy above Bullish Zone)
Short Trade
Sell below the bearish zone line or Sell when there is a rejection from the bullish zone
Example 1 (Sell Below Bearish Zone)
No Trade Zone
If the market move between the zones then, the momentum is very week.
Example 1
Отказ от ответственности
Все виды контента, которые вы можете увидеть на TradingView, не являются финансовыми, инвестиционными, торговыми или любыми другими рекомендациями. Мы не предоставляем советы по покупке и продаже активов. Подробнее — в Условиях использования TradingView.