PROTECTED SOURCE SCRIPT
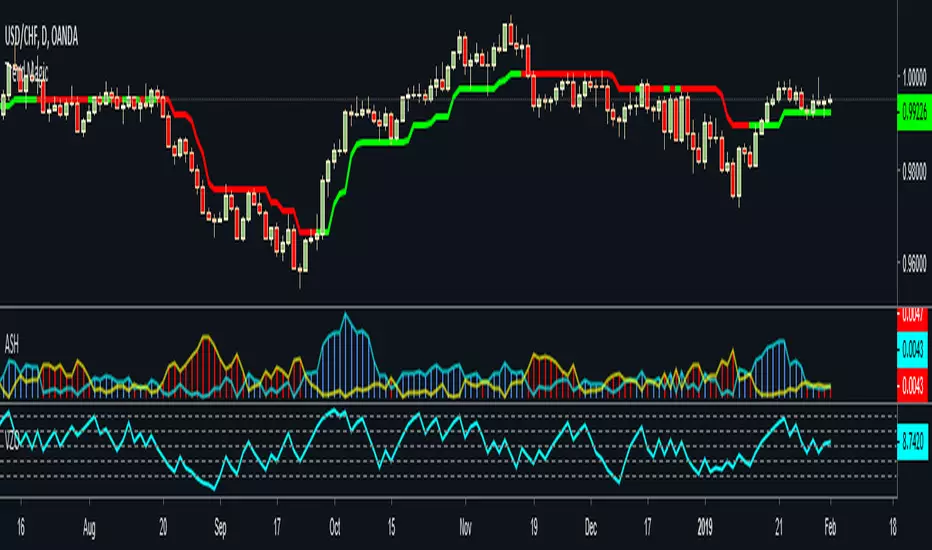
Volume Zone Oscillator

Copy Pasta from Investopedia
Interpretation
The VZO points to a positive trend when it rises above and maintains the 5% level, and a negative trend when it falls below the 5% level and fails to turn higher. Oscillations between the 5% and 40% levels mark a bullish trend zone, while oscillations between -40% and 5% mark a bearish trend zone. Meanwhile, readings above 40% signal an overbought condition, while readings above 60% signal an extremely overbought condition. Alternatively, readings below -40% indicate an oversold condition, which becomes extremely oversold below -60%.
The indicator panel shows horizontal lines that correspond with relative percentage levels that trigger buy and sell signals when crossed:
BUY OR COVER SIGNAL - cross from below to above the -40% line.
SELL OR SELL SHORT SIGNAL - cross from above to below the 40% line.
LESSER BUY OR COVER SIGNAL – cross from below to above the 5% line, but any subsequent violation adds a 7.5% buffer zone before the next buy signal.
A 14-period average directional index (ADX) can be used with the VZO, with values greater than 18 pointing to a trending market. A 60-period exponential moving average (EMA) is examined when ADX signals a trend, with price crossing above the moving average denoting a positive trend, while a downward crossover points to a bearish trend. These values should be tweaked and optimized by backtesting specific securities.
Price pattern and other indicators can be examined to confirm VZO buy or sell signals. Volume bars common on most price charts provides useful information in this regard, adding to signal reliability when bullish and bearish crosses align with two times or greater average volume. In addition, look for OBV to tick higher when the VZO has pushed above 50% and lower when it falls below that level. (For more, see: How to Use Volume to Improve Your Trading.)
And there are better uses for this Indicator than the above description ;)
happy trading
Скрипт с защищённым кодом
Этот скрипт опубликован с закрытым исходным кодом. Однако вы можете использовать его свободно и без каких-либо ограничений — читайте подробнее здесь.
Отказ от ответственности
Все виды контента, которые вы можете увидеть на TradingView, не являются финансовыми, инвестиционными, торговыми или любыми другими рекомендациями. Мы не предоставляем советы по покупке и продаже активов. Подробнее — в Условиях использования TradingView.