PROTECTED SOURCE SCRIPT
Profit Accumulator Volatility
Обновлено
Hi Everyone
I thought I'd share my new volatility trend indicator for anyone to use.
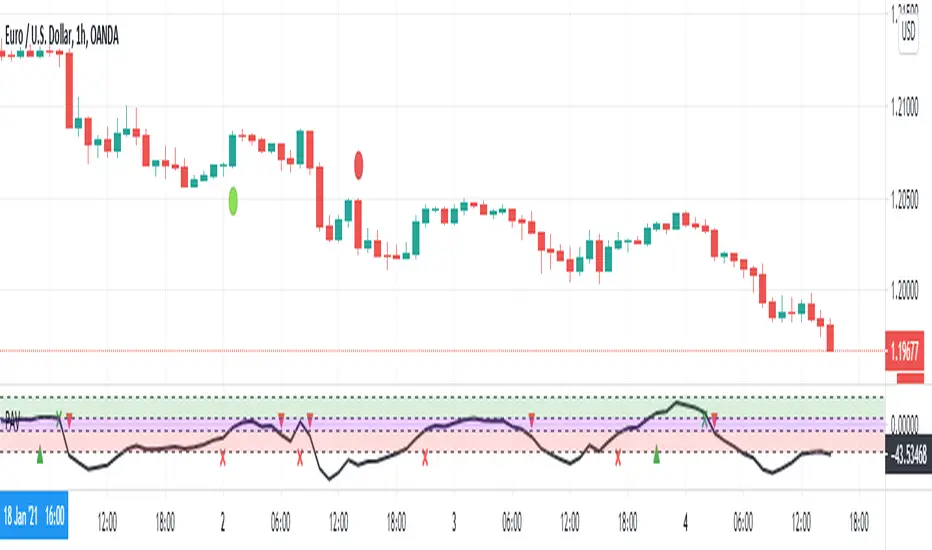
The indicator tracks the volatility in the market and plots this accordingly. Any plot above the zero line is a bullish signal and anything below the zero line is a bearish signal.
Long and Short Entry points are indicated at the 10 and -10 values respectively. A value of over 40 , or under -40 indicates a strong trend.
Possible entry and exit points are also highlighted on the chart.
I've added alerts onto this indicator highlighting possible entry and exit points as well as when strong trends are developing and when they are over.
This is intended to be used with your own indicators and/or analysis of the market and should be used carefully.
I personally like to use this indicator for entry on the one hour chart and then drop down to the 15 minute chart to confirm my entry and to use that timeframe for my exit.
Please feel free to forward any improvements that you'd like to make.
Cheers
Mike
I thought I'd share my new volatility trend indicator for anyone to use.
The indicator tracks the volatility in the market and plots this accordingly. Any plot above the zero line is a bullish signal and anything below the zero line is a bearish signal.
Long and Short Entry points are indicated at the 10 and -10 values respectively. A value of over 40 , or under -40 indicates a strong trend.
Possible entry and exit points are also highlighted on the chart.
I've added alerts onto this indicator highlighting possible entry and exit points as well as when strong trends are developing and when they are over.
This is intended to be used with your own indicators and/or analysis of the market and should be used carefully.
I personally like to use this indicator for entry on the one hour chart and then drop down to the 15 minute chart to confirm my entry and to use that timeframe for my exit.
Please feel free to forward any improvements that you'd like to make.
Cheers
Mike
Информация о релизе
Slight error in the initial publish for the exit indicator that is now resolved. Информация о релизе
Added an exit factor for the user to select their end point. This is when the volatility value crosses the exit factor that an exit indicator is triggered.This has a default value of 20/-20.
Отказ от ответственности
Все виды контента, которые вы можете увидеть на TradingView, не являются финансовыми, инвестиционными, торговыми или любыми другими рекомендациями. Мы не предоставляем советы по покупке и продаже активов. Подробнее — в Условиях использования TradingView.