OPEN-SOURCE SCRIPT
RelativeVolatilityIndicator with Trend Filter
Обновлено
Guide to the Relative Volatility Indicator with Trend Filter (RVI_TF)
Introduction
The Relative Volatility Indicator with Trend Filter (RVI_TF) aims to provide traders with a comprehensive tool to analyze market volatility and trend direction. This unique indicator combines volatility ratio calculations with a trend filter to help you make more informed trading decisions.
Key Components
Scaled Volatility Ratio: This measures the current market volatility relative to historical volatility and scales the values for better visualization.
Fast and Slow Moving Averages for Volatility: These provide a smoothed representation of the scaled volatility ratio, making it easier to spot trends in market volatility.
Trend Filter: An additional line representing a long-term Simple Moving Average (SMA) to help you identify the prevailing market trend.
User Inputs
Short and Long ATR Period: These allow you to define the length for calculating the Average True Range (ATR), used in the volatility ratio.
Short and Long StdDev Period: Periods for short-term and long-term standard deviation calculations.
Min and Max Volatility Ratio for Scaling: Scale the volatility ratio between these min and max values.
Fast and Slow SMA Period for Volatility Ratio: Periods for the fast and slow Simple Moving Averages of the scaled volatility ratio.
Trend Filter Period: Period for the long-term SMA, used in the trend filter.
Show Trend Filter: Toggle to show/hide the trend filter line.
Trend Filter Opacity: Adjust the opacity of the trend filter line.
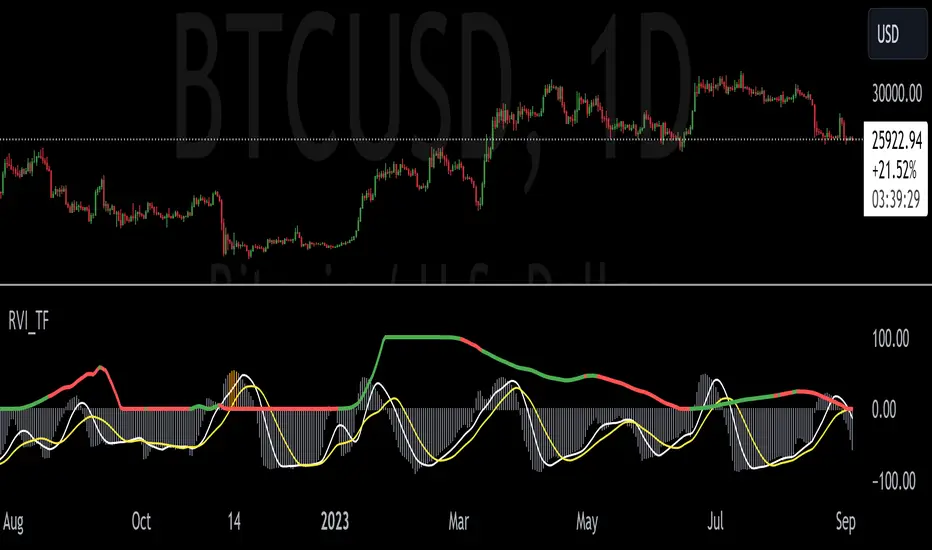
Visual Components
Histogram: The scaled volatility ratio is displayed as a histogram. It changes color based on the ratio value.
Fast and Slow Moving Averages: These are plotted over the histogram for additional context.
Trend Filter Line: Shown when the corresponding toggle is enabled, this line gives an indication of the general market trend.
How to Use
Volatility Analysis: Look for divergences between the fast and slow MAs of the scaled volatility ratio. It can signal potential reversals or continuation of trends.
Trend Confirmation: Use the Trend Filter line to confirm the direction of the current trend.
Conclusion
The RVI_TF is a multi-faceted indicator designed for traders who seek to integrate both volatility and trend analysis into their trading strategies. By providing a clearer understanding of market conditions, this indicator can be a valuable asset in a trader's toolkit.
Introduction
The Relative Volatility Indicator with Trend Filter (RVI_TF) aims to provide traders with a comprehensive tool to analyze market volatility and trend direction. This unique indicator combines volatility ratio calculations with a trend filter to help you make more informed trading decisions.
Key Components
Scaled Volatility Ratio: This measures the current market volatility relative to historical volatility and scales the values for better visualization.
Fast and Slow Moving Averages for Volatility: These provide a smoothed representation of the scaled volatility ratio, making it easier to spot trends in market volatility.
Trend Filter: An additional line representing a long-term Simple Moving Average (SMA) to help you identify the prevailing market trend.
User Inputs
Short and Long ATR Period: These allow you to define the length for calculating the Average True Range (ATR), used in the volatility ratio.
Short and Long StdDev Period: Periods for short-term and long-term standard deviation calculations.
Min and Max Volatility Ratio for Scaling: Scale the volatility ratio between these min and max values.
Fast and Slow SMA Period for Volatility Ratio: Periods for the fast and slow Simple Moving Averages of the scaled volatility ratio.
Trend Filter Period: Period for the long-term SMA, used in the trend filter.
Show Trend Filter: Toggle to show/hide the trend filter line.
Trend Filter Opacity: Adjust the opacity of the trend filter line.
Visual Components
Histogram: The scaled volatility ratio is displayed as a histogram. It changes color based on the ratio value.
Fast and Slow Moving Averages: These are plotted over the histogram for additional context.
Trend Filter Line: Shown when the corresponding toggle is enabled, this line gives an indication of the general market trend.
How to Use
Volatility Analysis: Look for divergences between the fast and slow MAs of the scaled volatility ratio. It can signal potential reversals or continuation of trends.
Trend Confirmation: Use the Trend Filter line to confirm the direction of the current trend.
Conclusion
The RVI_TF is a multi-faceted indicator designed for traders who seek to integrate both volatility and trend analysis into their trading strategies. By providing a clearer understanding of market conditions, this indicator can be a valuable asset in a trader's toolkit.
Информация о релизе
Added inputs for changing colors Информация о релизе
Updated default settingsCleaned up example chart
Скрипт с открытым кодом
В истинном духе TradingView автор этого скрипта опубликовал его с открытым исходным кодом, чтобы трейдеры могли понять, как он работает, и проверить на практике. Вы можете воспользоваться им бесплатно, но повторное использование этого кода в публикации регулируется Правилами поведения. Вы можете добавить этот скрипт в избранное и использовать его на графике.
Отказ от ответственности
Все виды контента, которые вы можете увидеть на TradingView, не являются финансовыми, инвестиционными, торговыми или любыми другими рекомендациями. Мы не предоставляем советы по покупке и продаже активов. Подробнее — в Условиях использования TradingView.