OPEN-SOURCE SCRIPT
Moving Average Buy/Sell Indicator
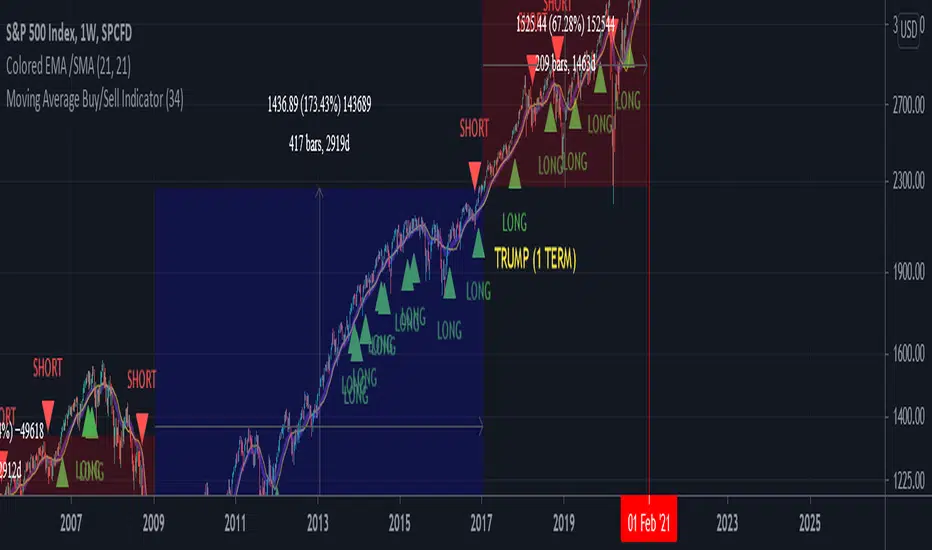
Using a selected Exponential Moving Average (EMA)/Simple Moving Average (SMA) range, this indicator inserts a Long/Short (buy/sell) indicator overlaid on chart depending on the following conditions:
- LONG/BUY SIGNAL = if SMA value is less than EMA, and both the SMA and EMA are less than the current average price.
- SHORT/SELL SIGNAL = if SMA value is greater than EMA, and both the SMA and EMA are greater than the current average price.
**Intended for use with the 21 and 34 weekly moving average time range. Much more useful for long-term analysis rather than short-term analysis.**
Скрипт с открытым кодом
В истинном духе TradingView автор этого скрипта опубликовал его с открытым исходным кодом, чтобы трейдеры могли понять, как он работает, и проверить на практике. Вы можете воспользоваться им бесплатно, но повторное использование этого кода в публикации регулируется Правилами поведения. Вы можете добавить этот скрипт в избранное и использовать его на графике.
Отказ от ответственности
Все виды контента, которые вы можете увидеть на TradingView, не являются финансовыми, инвестиционными, торговыми или любыми другими рекомендациями. Мы не предоставляем советы по покупке и продаже активов. Подробнее — в Условиях использования TradingView.