OPEN-SOURCE SCRIPT
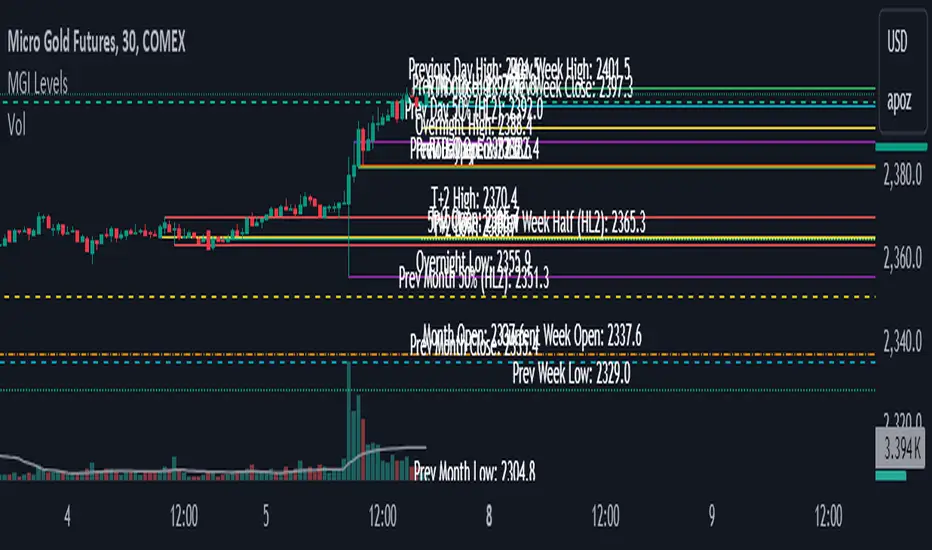
Daily Levels Suite + Market Breadth
Обновлено
There are many levels suites out there but many of them use the line series and/or label series to create multiple levels. Pine v5 provides the capability to use line arrays and labels so I wanted to create some code that is extensible to add additional lines/levels and labels to an array of lines with very little effort.
There is also some Market Breadth info that can be shown in the corners of the chart to allow a user to understand how the broader markets are moving compared to the security they are charting.
Current Levels provided are as follows:
Today's Open
Previous Days Close
Previous Days High/Low
Previous Days 50%
T+2 High/Low
All levels and the market breadth table is configurable to be hidden or shown based upon the user's desire.
Информация о релизе
Fixed the issue when ETH is on the levels lagging by a dayAdded new levels for futures That will only show up if you are looking at a futures chart
Globex Open
Regular Trading Hours Open (RTH Open)
Added Overnight High/Low (Need ETH on to see these levels)
Modified the setting box to make it a bit cleaner by moving on/off inline with color selection.
There is one outstanding issue with the close price when on a futures ticker, need to do some more research but there is plenty of good updates that I didn't want to delay the update.
Информация о релизе
Updates:- Overnight Low/High are now populated even with ETH off (limitation is these levels cannot be seen above 30 min timeframe due to current implementation)
- Added Weekly and Monthly Levels
- Overhauled Input Settings
- User can now determine how many previous daily, weekly, and monthly sessions to display
- Customize daily, weekly, and monthly levels with different line styles, thicknesses, and label offsets
- Added TRIN.NY and TICK to Market Breadth Table
- Added column for current TPO session and time left in current TPO for all you market profile enthusiasts
Информация о релизе
Changes:- Fixed various bugs related to timeframes (ETH vs. RTH) that were giving incorrect levels and/or labeling on various tickers
- Added more descriptive labels for weekly and monthly levels. They now state the actual month or date of the start of week instead of "Previous Month" or "Previous Week"
- Added option for VIX and VXN to the market breadth table
- Added Daily, Weekly, Monthly, Quarterly, and Yearly VWAPs each with up to 3 configurable standard deviations
Информация о релизе
Version 5 UpdateThis is a pretty large update and a long time coming for many of the folks requesting feature updates/bug fixes so here it goes!
- Added support for every type of ticker (i.e. Futures, Forex, Crypto, Stocks, Indices/Funds)
- Refactored code to add the feature of having lines go all the way back to the bar where the level was created. This was done to provide a better visual for the user
- Some caveats to the above are that on RTH type charts, the Overnight High/Low and Globex Open (if looking at a futures chart with RTH enabled) will start at RTH open since that data is not available from the chart.
- Levels will now update automatically as new levels are created
- For RTH charts all levels will update at market open (9:30 AM EST)
- For ETH charts (except futures) Overnight High/Low and RTH Open will be updated at New York RTH Open (9:30 EST) the
rest of the levels will update at RTH close (4:00 PM EST)
- For Futures charts, levels will be updated at Globex Open (6:00 PM EST) apart from Overnight High/Low and RTH Open as
mentioned above
- Weekly and Monthly Levels follow the same criteria but only updating when a new Month or Week is expected on the next
trading day.
- Added OC2 (Open + Close/2) to the daily levels
- Added RTH Open, OC2 (Open + Close / 2), RTH Close to both the Weekly and Monthly Levels
- Added the ability to change the text size of the labels
- Added the ability to add up to 5 different tickers to the market breadth table. The green/red shading changes based on if the current price is greater then the previous bar close.
- Took out the VWAP Indicators as the script inputs section was getting very long with those in there. I am working on creating a "VWAP Suite" indicator that will have all the same VWAPs that were in this script plus some extra ones.
- Various bug fixes reported in the comments throughout the past several months.
As I said before, this update is a very large one and testing all the different tickers by myself was extremely time consuming so I would not be surprised if there are some bugs left in the code somewhere. If you see any issues or if you have any additional feature requests you would like to see, please do not hesitate to leave a comment with a description of the issue/feature request and I will try to take them into consideration for the next update.
Информация о релизе
Version 6 Update- Refactored code to be a bit more readable
- Fixed an issue with labeling being incorrect on Weekly/Monthly Levels in some instances
- Added T+2 Open/Close to daily levels
- Added prior weeks weekly VWAP
Информация о релизе
Version 7 Updates- Allow users to modify names of levels. Current names are fairly verbose so I wanted to provide users a way to modify them to their liking.
- Added Midnight Open and London Open to the Daily Levels
- Added the ability to keep all previous day high/low/close on the chart until they are tested
- Added the ability to also keep tested previous day high/low/close on chart as well (mostly for backtesting purposes)
Информация о релизе
V8- Made some optimizations to reduce calculation timeouts
- Weekly VWAP only counts US RTH (9:30-4PM) towards its calculation
Информация о релизе
Version 9 Update- Fixed Issue with certain Daily levels causing script to error out
- Optimized processing of arrays to reduce the number of calculation timeouts
- Added Current Day High/Low per user request (disabled by default)
- Added a table entry to indicate if current day is an inside day or outside day (disabled by default)
- Did some general code clean up to make it a bit more readable
Информация о релизе
v10 Update- Optimized the code about as much as I can to further reduce any calculation timeout issues observed when changing timeframes/tickers.
- Changed the function of Overnight High/Low. It will now reset at RTH close and track the overnight high/low until RTH open. At that point it will stay in place until RTH close.
- Added support for London and Midnight Open to display with just RTH on on futures tickers.
- Other code optimizations to improve readbility
- Several bug fixes as I was going through the code for these other updates.
Информация о релизе
v11 Update/ChangesThis is another fairly large update with quite a few changes.
- Market Internals Table has been removed to help speed up the script processing. I have released it as a separate indicator here: https://www.tradingview.com/script/i0Oo6oMb-Market-Internals-Info/
- Changed the indicator name as it is shown on the chart to better reflect what the indicator is. It is now called 'MGI Levels' which stands for Market Generated Information Levels.
- Added option to remove price in label
- Added option to include Overnight High/Low in the Prev Day High/Low calculations
- Fixed bug with Futures RTH not updating daily levels at end of US session
- Added Prev Day VWAP Close + 1/2/3 Std Deviations
- Added Prev Month VWAP Close + 1/2/3 St Devations
- Added Opening Range and Initial Balance High/Low/Mid along with the ability to change the session times of those for folks who don't use 30m and 1 hour from open. (Be aware that the labels will overlap if the OR and IB values are the same. Dealing with overlapping labels was going to take too much code so I left it as is.)
- Added the ability to change the session time range if you want to have the "RTH" session include more or less time. This will affect the following levels if you change the session range:
Curr Day High/Low
Prev Day High/Low
RTH Open
Prev Day Close
Prev Day 50% (Both OC2)
Overnight High/Low (These always start at 1600 for equities and 1800 for Futures but the closing time will be affected by the start time of the session)
T+2 High/Low/Open/Close
Prev Day VWAP levels
All Weekly/Monthly Levels - Refactored the code again to make it more readable.
I think I covered everything that changed but as always if you find any issues or have any additional levels/feature requests please let me know.
Информация о релизе
v12 Updates- Fixed issue with "Include Overnight High/Low in Prev Day High/Low" not propagating to Weekly and Monthly Levels properly.
Информация о релизе
v13 Changes- Fixed Issue with Overnight High/Low updating incorrectly. Overnight High/Low starts at 1600 EST for securities and 1800 EST for futures. The end time for overnight will be based upon the end session time input into the Trading Session range variable.
- Fixed issue with Overnight Low color applying the Overnight High line color settings.
Информация о релизе
v14 Updates- Fixed bug with untested levels not clearing properly
- Added the Session Open to the untested levels option
Информация о релизе
v15 Updates- When selecting "None" for extend line option it now extends to the label offset instead of to just the last bar.
- Added support to deal with Good Friday holiday. Levels will update at the start of the next session.
- Added previous open to daily levels. When the session ends the RTH open level will disappear until the next user defined session starts. The previous open should be used if you want the prior open plotted.
- Added London/Euro close. My OCD could not handle having an odd number of daily levels in the list so I decided to add euro close to keep the list uniform.
- Cleaned up some of the VWAP calculation code to make it more readable
Информация о релизе
v15 Change List- Fixed Issue with RTH Open not showing up.
- Fixed Issue with ETH and Futures RTH not showing proper Prior Month High/Low/Close etc.
Информация о релизе
v16 Update- Used new profiler mode to optimize code to reduce calculation timeouts and speed up plotting. They may still occur but in my testing they have been significantly reduced with the time to execute the script sped up by ~200%.
- Added support for 30 second timeframe
Информация о релизе
v17-Fixed Issue with lines not plotting on certain tickers.
Информация о релизе
v19 Update (Skipped 18 because I mentioned v15 twice by accident)- Added Setting to allow the use of 30 second timeframe for the Opening Range and Initial Balance calculations if you TV plan supports it. Changed the default back to 1 min to support all Tradingview Plan Tiers.
Скрипт с открытым кодом
В истинном духе TradingView автор этого скрипта опубликовал его с открытым исходным кодом, чтобы трейдеры могли понять, как он работает, и проверить на практике. Вы можете воспользоваться им бесплатно, но повторное использование этого кода в публикации регулируется Правилами поведения. Вы можете добавить этот скрипт в избранное и использовать его на графике.
Отказ от ответственности
Все виды контента, которые вы можете увидеть на TradingView, не являются финансовыми, инвестиционными, торговыми или любыми другими рекомендациями. Мы не предоставляем советы по покупке и продаже активов. Подробнее — в Условиях использования TradingView.