OPEN-SOURCE SCRIPT
ICT IPDA
Обновлено
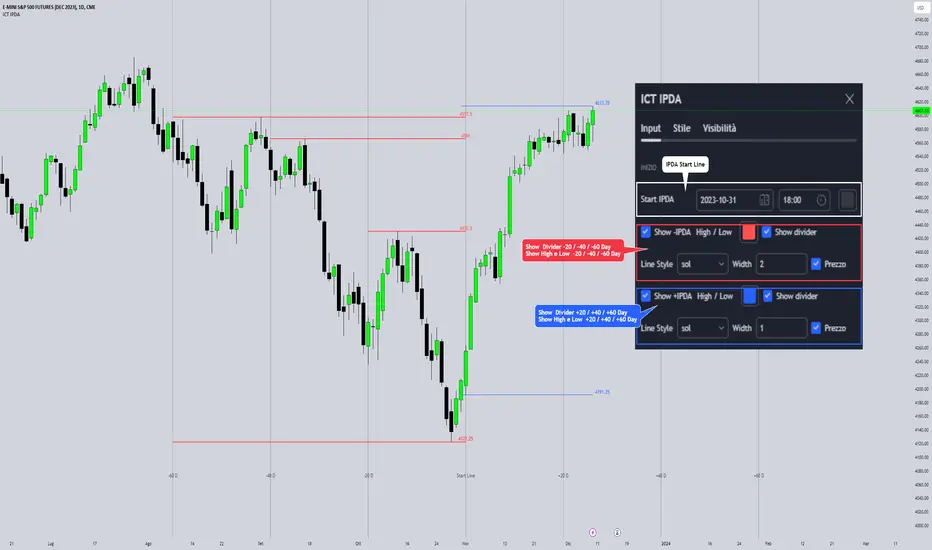
Guided by ICT tutoring, I create this versatile indicator "IPDA".
This indicator shows a different way of viewing the “IPDA” by calculating from START
(-20 / -40 / -60) to (+20 /+40 /+60) Days, showing the Highs and Lows of the IPDA of the Previous days and both of the subsequent ones, the levels of (-20 / -40 / -60) Days can be taken into consideration as objectives to be achieved in the range of days (+20 /+40 /+60)
The user has the possibility to:
- Choose whether to display IPDAs before and after START
- Choose to show High and Low levels
- Choose to show Prices
The indicator should be used as ICT shows in its concepts.
Example on how to evaluate a possible Start IPDA:

Example for Entry targeting IPDAs :

If something is not clear, comment below and I will reply as soon as possible.
This indicator shows a different way of viewing the “IPDA” by calculating from START
(-20 / -40 / -60) to (+20 /+40 /+60) Days, showing the Highs and Lows of the IPDA of the Previous days and both of the subsequent ones, the levels of (-20 / -40 / -60) Days can be taken into consideration as objectives to be achieved in the range of days (+20 /+40 /+60)
The user has the possibility to:
- Choose whether to display IPDAs before and after START
- Choose to show High and Low levels
- Choose to show Prices
The indicator should be used as ICT shows in its concepts.
Example on how to evaluate a possible Start IPDA:
Example for Entry targeting IPDAs :
If something is not clear, comment below and I will reply as soon as possible.
Информация о релизе
- Fixed High and LowИнформация о релизе
- Added choise IPDA for 'Long' or 'Short'Информация о релизе
- Added 'All' for show Line High and Low 20 -40 -60Информация о релизе
- Added Line 50%Скрипт с открытым кодом
В истинном духе TradingView автор этого скрипта опубликовал его с открытым исходным кодом, чтобы трейдеры могли понять, как он работает, и проверить на практике. Вы можете воспользоваться им бесплатно, но повторное использование этого кода в публикации регулируется Правилами поведения. Вы можете добавить этот скрипт в избранное и использовать его на графике.
Отказ от ответственности
Все виды контента, которые вы можете увидеть на TradingView, не являются финансовыми, инвестиционными, торговыми или любыми другими рекомендациями. Мы не предоставляем советы по покупке и продаже активов. Подробнее — в Условиях использования TradingView.