OPEN-SOURCE SCRIPT
Bias Daily
This indicator shows in a different way how to evaluate the BIAS Daily.
Evaluate yesterday's closed candle [1] and that of the day before yesterday [2]
The conditions are:
LONG BIAS =
Candle [1] closed above High Candle [2]
- In this condition a long continuation can be considered
SHORT BIAS =
The candle [1] closed below the low candle [2]
- In this condition a short continuation can be considered
IN THE RANGE =
The candle [1] did not close below or above the Low and High candle [2]
- In this condition it is better not to risk it
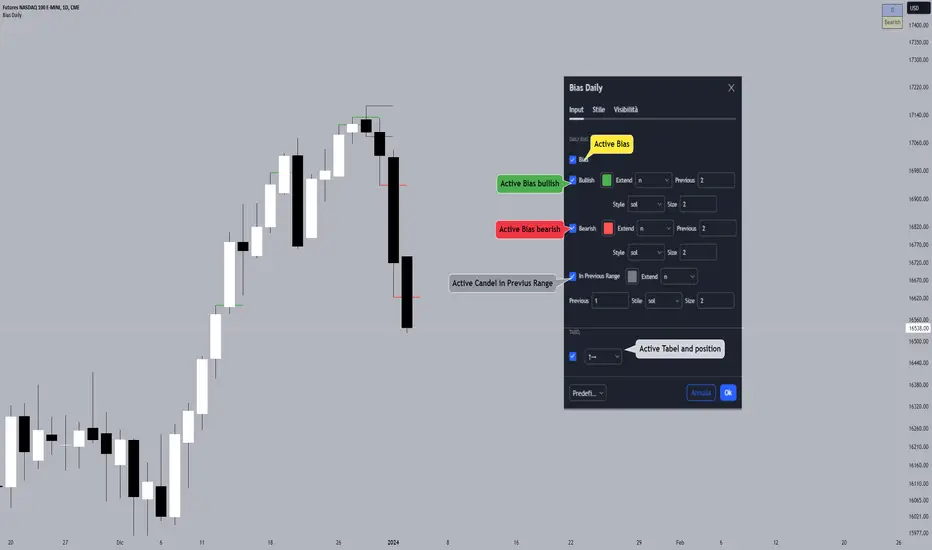
The user has the possibility to:
- Choose to show high or low BIAS levels
- Shows the Table in which the BIAS D is marked
The indicator should be used as TTrades shows in its videos, it can also be implemented in ICT strategies.
The indicator takes into consideration the last 2 candles already closed, so on the candle that is forming you can expect reactions in the Pd Array of the Candle Range [1], below I show examples of how to use it in Multitimeframe
BIAS LONG =

BIAS SHORT =

Evaluate yesterday's closed candle [1] and that of the day before yesterday [2]
The conditions are:
LONG BIAS =
Candle [1] closed above High Candle [2]
- In this condition a long continuation can be considered
SHORT BIAS =
The candle [1] closed below the low candle [2]
- In this condition a short continuation can be considered
IN THE RANGE =
The candle [1] did not close below or above the Low and High candle [2]
- In this condition it is better not to risk it
The user has the possibility to:
- Choose to show high or low BIAS levels
- Shows the Table in which the BIAS D is marked
The indicator should be used as TTrades shows in its videos, it can also be implemented in ICT strategies.
The indicator takes into consideration the last 2 candles already closed, so on the candle that is forming you can expect reactions in the Pd Array of the Candle Range [1], below I show examples of how to use it in Multitimeframe
BIAS LONG =
BIAS SHORT =
Скрипт с открытым кодом
В истинном духе TradingView автор этого скрипта опубликовал его с открытым исходным кодом, чтобы трейдеры могли понять, как он работает, и проверить на практике. Вы можете воспользоваться им бесплатно, но повторное использование этого кода в публикации регулируется Правилами поведения. Вы можете добавить этот скрипт в избранное и использовать его на графике.
Отказ от ответственности
Все виды контента, которые вы можете увидеть на TradingView, не являются финансовыми, инвестиционными, торговыми или любыми другими рекомендациями. Мы не предоставляем советы по покупке и продаже активов. Подробнее — в Условиях использования TradingView.