OPEN-SOURCE SCRIPT
[R]2 - Reversion
Обновлено
The Idea:
I had the idea for this script when I read an article about how assets tend to revert to their long-term average or mean. The concept behind "R2" is based on the assumption that extreme deviations from the average tend to be corrected. For example, if an asset is trading well above its historical average, there is a possibility that the price will return towards the average. Conversely, if an asset is trading well below its average, there is a tendency for it to move back towards the average.
This concept serves as the foundation for this script. I have tried to keep the representation as simple as possible, and please remember that "Reversion" (as it's called in financial terms) is not a guaranteed rule but a statistical phenomenon.
The Indicator:
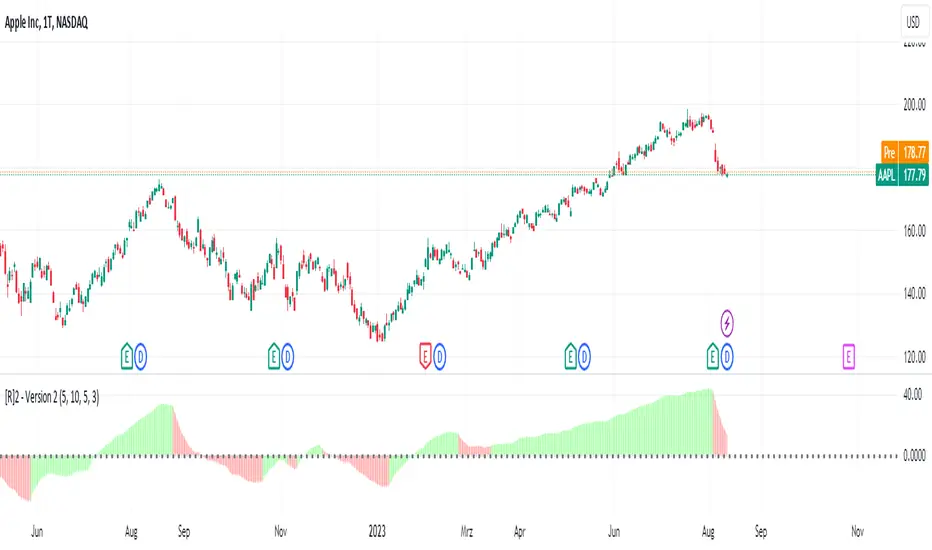
This indicator calculates the average and the distance of closing prices from this average every X periods. The calculated value fluctuates between 0. If the calculated value moves from above towards the zero line, it may indicate further declining prices. If the value moves from below towards the zero line, it may indicate rising prices. If the value is below the zero line, the area between the zero line and the calculated value is displayed in red. If the value is above the zero line, the area is displayed in green.
You can adjust the number of periods. The 'Multiplier' allows you to set how sensitive the indicator reacts, and the 'Threshold' variable sets the threshold for calculating a new average. It's best to adjust the settings to find the most suitable configuration for your needs.
I had the idea for this script when I read an article about how assets tend to revert to their long-term average or mean. The concept behind "R2" is based on the assumption that extreme deviations from the average tend to be corrected. For example, if an asset is trading well above its historical average, there is a possibility that the price will return towards the average. Conversely, if an asset is trading well below its average, there is a tendency for it to move back towards the average.
This concept serves as the foundation for this script. I have tried to keep the representation as simple as possible, and please remember that "Reversion" (as it's called in financial terms) is not a guaranteed rule but a statistical phenomenon.
The Indicator:
This indicator calculates the average and the distance of closing prices from this average every X periods. The calculated value fluctuates between 0. If the calculated value moves from above towards the zero line, it may indicate further declining prices. If the value moves from below towards the zero line, it may indicate rising prices. If the value is below the zero line, the area between the zero line and the calculated value is displayed in red. If the value is above the zero line, the area is displayed in green.
You can adjust the number of periods. The 'Multiplier' allows you to set how sensitive the indicator reacts, and the 'Threshold' variable sets the threshold for calculating a new average. It's best to adjust the settings to find the most suitable configuration for your needs.
Информация о релизе
I have revised the indicator so that the turning point can be detected, and this is made visible by changing the color scheme. I use the indicator to alert me to potential trend changes.In the daily or weekly chart, I closely observe the changes in the indicator. When a potential turning point appears, and the indicator signals a change in direction, I become alert. However, I am cautious and do not immediately enter the market. Instead, I use this information as an initial hint of a possible trend reversal.
Subsequently, I closely monitor the further developments in the candlestick chart to look for additional confirmations of the suspected trend change. I also take into consideration other technical indicators and fundamental information to support my decision.
Only when I receive multiple confirmation signals and the indications of a trend reversal are strong, do I identify a suitable entry opportunity. This could be a pullback, consolidation, or a new signal from the indicator that confirms my initial assumption.
Through this approach, I aim to become aware of potential trend changes early on while minimizing risks. It is essential to emphasize that no indicator or analysis tool is 100% error-free; therefore, I remain disciplined and adhere to my predefined trading rules and risk management strategies.
Информация о релизе
Added alarmИнформация о релизе
In the original version, the indicator turned red when the value fell below 0 and green when the value was above 0. I changed that, and the color change occurred when the indicator changed direction. However, I found that it is better to wait until the indicator crosses the zero line. Therefore, I added the possibility to switch between them.
Of course, you can still wait until the zero line is crossed, but I often caught myself reacting too early. :)
I use the indicator to detect medium with long-term trends.
I wish everyone successful trades and health to have fun spending money ;)
Скрипт с открытым кодом
В истинном духе TradingView автор этого скрипта опубликовал его с открытым исходным кодом, чтобы трейдеры могли понять, как он работает, и проверить на практике. Вы можете воспользоваться им бесплатно, но повторное использование этого кода в публикации регулируется Правилами поведения. Вы можете добавить этот скрипт в избранное и использовать его на графике.
Отказ от ответственности
Все виды контента, которые вы можете увидеть на TradingView, не являются финансовыми, инвестиционными, торговыми или любыми другими рекомендациями. Мы не предоставляем советы по покупке и продаже активов. Подробнее — в Условиях использования TradingView.