OPEN-SOURCE SCRIPT
[A618] Historical Volatility Bands
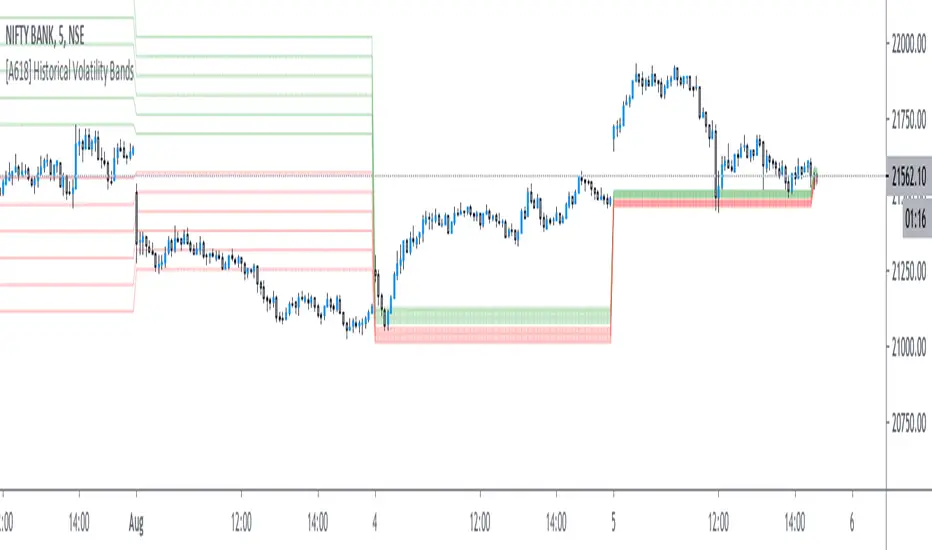
Historical Volatility Bands
To be used over 5 mins for best results
HVB is a standard deviation measure for Historical Volatility Percentile,
It helps you figure out the next level of Support and Resistances
> If the HVB width is narrow, its an indication for a Trending market day
> Price crossing the highest green band line symbolises a nice upmove
> Price crossing the lowest red band line symbolises a nice downmove
> Green and Red lines are levels of Support and Resistances with respect to Historical Volatility
Credits
Historical Volatility Percentile calculation part : cheatcountry
Link to cheatcountry idea
Hope this Helps!
Скрипт с открытым кодом
В истинном духе TradingView автор этого скрипта опубликовал его с открытым исходным кодом, чтобы трейдеры могли понять, как он работает, и проверить на практике. Вы можете воспользоваться им бесплатно, но повторное использование этого кода в публикации регулируется Правилами поведения. Вы можете добавить этот скрипт в избранное и использовать его на графике.
Get Ocs Ai Trader, Your personal Ai Trade Assistant here
→ ocstrader.com
→ bit.ly/ocs_ai_trader
About me
AlgoTrading Certification, (University of Oxford, Säid Business School)
PGP Research Analysis, (NISM)
Electronics Engineer
→ ocstrader.com
→ bit.ly/ocs_ai_trader
About me
AlgoTrading Certification, (University of Oxford, Säid Business School)
PGP Research Analysis, (NISM)
Electronics Engineer
Отказ от ответственности
Все виды контента, которые вы можете увидеть на TradingView, не являются финансовыми, инвестиционными, торговыми или любыми другими рекомендациями. Мы не предоставляем советы по покупке и продаже активов. Подробнее — в Условиях использования TradingView.