PROTECTED SOURCE SCRIPT
Simple charting tool box (5 tools)
Обновлено
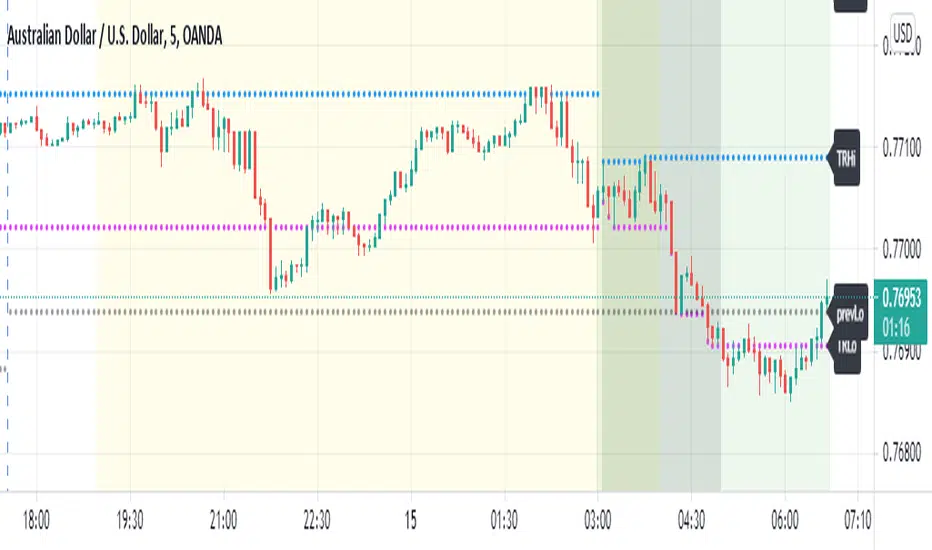
This is a simple charting tool box that allows you to do 5 things:
The drawings use exchange time of your data feed. For Oanda feed, it is NY time (UTC-4).
Hope the tool helps. Enjoy!
- 1. Highlight custom time range with transparent background.
- 2. Plot High, Low of the custom time range and extension.
- 3. Plot previous day High, Low
- 4. Highlight market sessions (Sydney, Tokyo, London, New York), session times are customizable.
- 5. Plot ATR Projections
The drawings use exchange time of your data feed. For Oanda feed, it is NY time (UTC-4).
Hope the tool helps. Enjoy!
Информация о релизе
[15 June 2021 update: input function]Original description:
This is a simple charting tool box that allows you to do 5 things:
1. Highlight custom time range with transparent background.
2. Plot High, Low of the custom time range and extension.
3. Plot previous day High, Low
4. Highlight market sessions (Sydney, Tokyo, London, New York), session times are customizable.
5. Plot ATR Projections
The drawings use exchange time of your data feed. For Oanda feed, it is NY time (UTC-4).
Hope the tool helps. Enjoy!
Отказ от ответственности
Все виды контента, которые вы можете увидеть на TradingView, не являются финансовыми, инвестиционными, торговыми или любыми другими рекомендациями. Мы не предоставляем советы по покупке и продаже активов. Подробнее — в Условиях использования TradingView.