OPEN-SOURCE SCRIPT
Bollinger bands volume support&resistance multi timeframe [LM]
Обновлено
Hello traders,
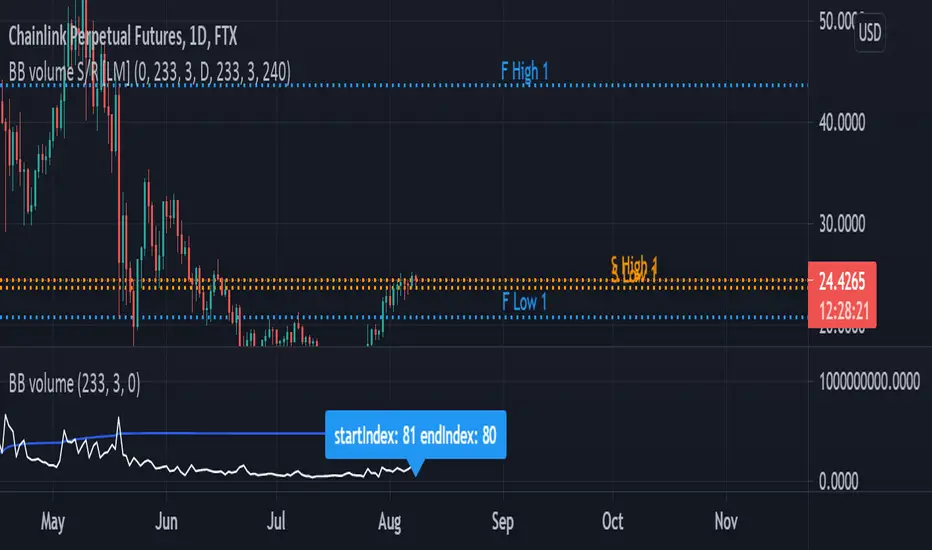
I would like to introduce you Bollinger bands volume support&resistance multi timeframe script. The benchmark is the Upper Bollinger Band applied on volume with a look-back setting of 233 and a displacement of 3 standard deviations.
(There’s nothing magical about the setting of 233, but you should use a long-term parameter so that you get a stable Bollinger Band. Short-term parameters tend to produce erratic bands.)
If a price bar shows volume that exceeds this benchmark, we will zoom in and use it as potential support or resistance area in our price analysis. if there is only one candle that will crossover and cross under than only high and lo of that candle is counting. If there are more consecutive bars that are above upper bollinger band than the range high and lo is calculated from high and lows of that candle
As you can see on the image high and low is only rendered when volume crossover and cross under bollinger bands

I hope you will enjoy it
I would like to introduce you Bollinger bands volume support&resistance multi timeframe script. The benchmark is the Upper Bollinger Band applied on volume with a look-back setting of 233 and a displacement of 3 standard deviations.
(There’s nothing magical about the setting of 233, but you should use a long-term parameter so that you get a stable Bollinger Band. Short-term parameters tend to produce erratic bands.)
If a price bar shows volume that exceeds this benchmark, we will zoom in and use it as potential support or resistance area in our price analysis. if there is only one candle that will crossover and cross under than only high and lo of that candle is counting. If there are more consecutive bars that are above upper bollinger band than the range high and lo is calculated from high and lows of that candle
As you can see on the image high and low is only rendered when volume crossover and cross under bollinger bands
I hope you will enjoy it
Информация о релизе
update to version 5Скрипт с открытым кодом
В истинном духе TradingView автор этого скрипта опубликовал его с открытым исходным кодом, чтобы трейдеры могли понять, как он работает, и проверить на практике. Вы можете воспользоваться им бесплатно, но повторное использование этого кода в публикации регулируется Правилами поведения. Вы можете добавить этот скрипт в избранное и использовать его на графике.
Отказ от ответственности
Все виды контента, которые вы можете увидеть на TradingView, не являются финансовыми, инвестиционными, торговыми или любыми другими рекомендациями. Мы не предоставляем советы по покупке и продаже активов. Подробнее — в Условиях использования TradingView.