PROTECTED SOURCE SCRIPT
Multi-Timeframe Intrabar CRT Candles
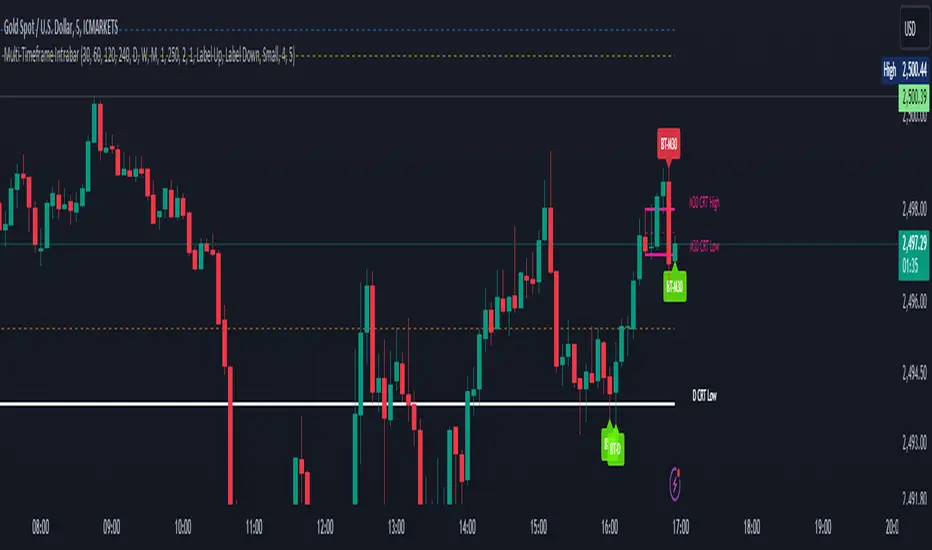
# Multi-Timeframe Intrabar Indicator
This advanced indicator visualizes Candle Range Theory (CRT) across multiple timeframes, providing traders with a comprehensive view of market structure and potential high-probability setups.
## Key Features:
- Supports 7 timeframes: 30 minutes, 1 hour, 2 hours, 4 hours, daily, weekly, and monthly
- Customizable color schemes for each timeframe
- Options to display mid-level (50%) lines for each range
- Bullish and bearish touch detection with customizable label display
- End-of-line labels for easy identification of CRT levels
- Flexible alert system for touch detections on each timeframe
- Adjustable minimum and maximum bar count for range validity
- Options for wick touch and body touch detection
## How It Works:
The indicator plots CRT ranges for each selected timeframe, identifying potential accumulation, manipulation, and distribution phases. It detects when price touches these levels, providing visual cues and optional alerts for potential trade setups.
## Customization:
Users can fine-tune the indicator's appearance and functionality through various input options, including:
- Toggling timeframes on/off
- Adjusting colors for range lines and mid-levels
- Controlling label display and count
- Setting alert preferences
- Adjusting line widths and label offsets
## Usage:
This indicator is designed for traders familiar with Candle Range Theory and multi-timeframe analysis. It can be used to identify potential entry and exit points, confirm trends, and spot potential reversals across different timeframes.
## Note:
This indicator is for educational and informational purposes only. Always combine with other forms of analysis and proper risk management when making trading decisions.
## Credits:
Inspired by Romeo's Candle Range Theory and developed to provide a comprehensive multi-timeframe analysis tool.
Отказ от ответственности
Все виды контента, которые вы можете увидеть на TradingView, не являются финансовыми, инвестиционными, торговыми или любыми другими рекомендациями. Мы не предоставляем советы по покупке и продаже активов. Подробнее — в Условиях использования TradingView.