OPEN-SOURCE SCRIPT
Bubbles Volume [BigBeluga]
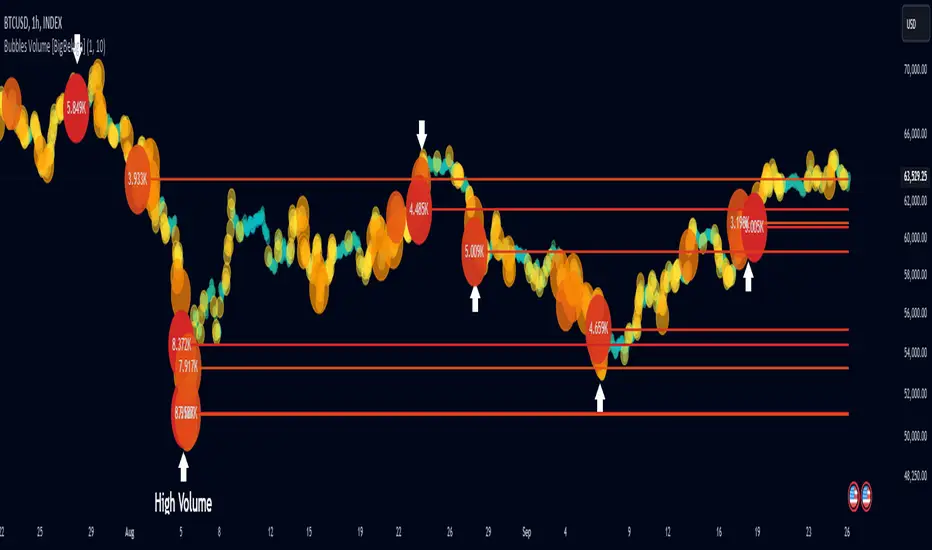
The Bubbles Volume indicator is an innovative visualization tool designed to represent trading volume in a more intuitive and visually appealing manner. By displaying volume as bubbles of varying sizes and colors on the price chart, this indicator helps traders quickly identify significant volume levels and potential areas of interest.
Important Note:
For correct visual representation of indicator, layout it to front:

🔵KEY FEATURES
● Volume Bubbles

● Heatmap Coloring

● Significant Volume Levels
Volume Levels:

Levels with HeatMap:

Levels without Volume Bubles:

● Normalized Volume Calculation
🔵HOW TO USE
● Volume Analysis
● Trend Confirmation

● Support and Resistance

● Divergences
● Volatility Assessment
🔵CUSTOMIZATION
The Bubbles Volume indicator offers several customization options:
By fine-tuning these settings, traders can adapt the indicator to various market conditions and personal analysis preferences.
The Bubbles Volume indicator provides a unique and intuitive way to visualize trading volume directly on the price chart. This approach allows traders to quickly identify areas of significant trading activity and potential price levels of interest without the need for a separate volume sub-chart.
This tool can be particularly useful for traders focusing on volume analysis, breakout strategies, or those looking to confirm price action with volume. The visual nature of the bubbles makes it easy to spot volume patterns and anomalies at a glance, potentially leading to faster and more informed trading decisions.
As with all technical indicators, it's recommended to use the Bubbles Volume indicator in conjunction with other forms of analysis and within the context of a well-defined trading strategy. While this indicator provides valuable volume insights, it should be considered alongside other factors such as overall market trends, price patterns, and fundamental analysis when making trading decisions.
Important Note:
For correct visual representation of indicator, layout it to front:
🔵KEY FEATURES
● Volume Bubbles
- Represents trading volume as bubbles on the price chart
- Bubble size increases with higher volume levels
- Color intensity changes based on volume significance
- Provides an intuitive visual representation of volume distribution
● Heatmap Coloring
- Optional feature to color bubbles based on volume intensity
- Uses a color gradient from cool (low volume) to hot (high volume) colors
- Helps quickly identify extremely high volume areas
● Significant Volume Levels
- Option to display horizontal lines at significant volume levels
- Shows volume amount as labels for highly significant levels
- Helps identify potential support/resistance areas based on volume
Volume Levels:
Levels with HeatMap:
Levels without Volume Bubles:
● Normalized Volume Calculation
- Uses normalized volume to account for overall market volume trends
- Provides a more accurate representation of volume significance
🔵HOW TO USE
● Volume Analysis
- Larger bubbles indicate higher trading volume
- Clusters of large bubbles may suggest areas of high interest or potential reversals
- Use in conjunction with price action to identify potential breakouts or fakeouts
● Trend Confirmation
- Strong trends often show increasing bubble sizes in the trend direction
- Diminishing bubble sizes might indicate weakening trends
● Support and Resistance
- Significant volume levels (displayed as lines) can act as potential support/resistance
- Pay attention to price reactions at these levels for trading opportunities
● Divergences
- Look for divergences between price action and bubble sizes
- Price making new highs/lows with smaller bubbles might indicate weakening momentum
● Volatility Assessment
- Periods with consistently large bubbles indicate high volatility
- Can be used to adjust trading strategies or position sizing
🔵CUSTOMIZATION
The Bubbles Volume indicator offers several customization options:
- Toggle bubble display on/off
- Adjust volume threshold for filtering low volume bubbles
- Enable/disable heatmap coloring for enhanced visual analysis
- Show/hide significant volume levels
- Adjust the number of significant levels displayed
- Customize colors to suit personal preferences
By fine-tuning these settings, traders can adapt the indicator to various market conditions and personal analysis preferences.
The Bubbles Volume indicator provides a unique and intuitive way to visualize trading volume directly on the price chart. This approach allows traders to quickly identify areas of significant trading activity and potential price levels of interest without the need for a separate volume sub-chart.
This tool can be particularly useful for traders focusing on volume analysis, breakout strategies, or those looking to confirm price action with volume. The visual nature of the bubbles makes it easy to spot volume patterns and anomalies at a glance, potentially leading to faster and more informed trading decisions.
As with all technical indicators, it's recommended to use the Bubbles Volume indicator in conjunction with other forms of analysis and within the context of a well-defined trading strategy. While this indicator provides valuable volume insights, it should be considered alongside other factors such as overall market trends, price patterns, and fundamental analysis when making trading decisions.
Скрипт с открытым кодом
В истинном духе TradingView автор этого скрипта опубликовал его с открытым исходным кодом, чтобы трейдеры могли понять, как он работает, и проверить на практике. Вы можете воспользоваться им бесплатно, но повторное использование этого кода в публикации регулируется Правилами поведения. Вы можете добавить этот скрипт в избранное и использовать его на графике.
Gain exclusive access to our powerful tools : bigbeluga.com
Join our free discord for updates : bigbeluga.com/discord
All scripts & content provided by BigBeluga are for informational & educational purposes only.
Join our free discord for updates : bigbeluga.com/discord
All scripts & content provided by BigBeluga are for informational & educational purposes only.
Отказ от ответственности
Все виды контента, которые вы можете увидеть на TradingView, не являются финансовыми, инвестиционными, торговыми или любыми другими рекомендациями. Мы не предоставляем советы по покупке и продаже активов. Подробнее — в Условиях использования TradingView.