OPEN-SOURCE SCRIPT
RSI in Bollinger bands
Обновлено
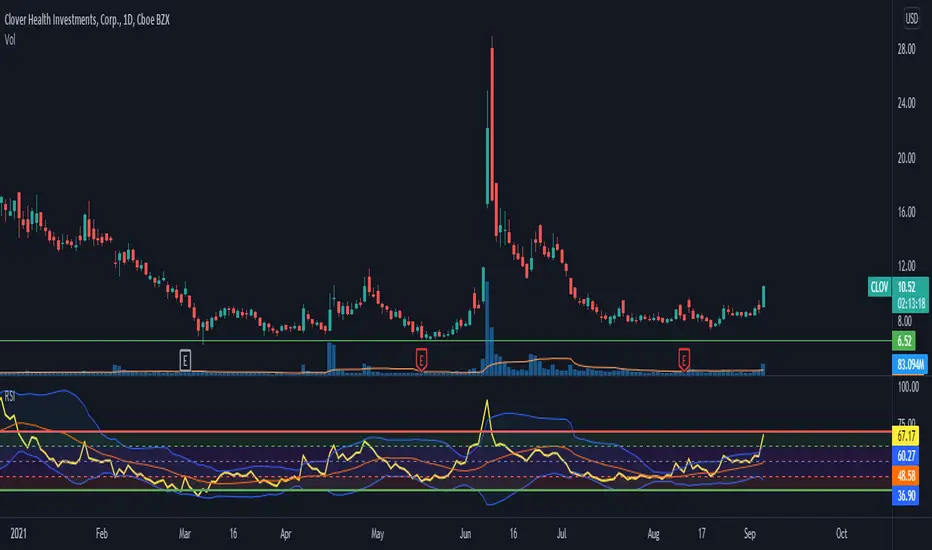
I added Bolinger bands to the RSI indicator.
This shows you the area of reversal for the RSI. Generally, when the indicator falls out of the bands, you'll see a quick reversal. Indeed this is a better way to find the overbought and oversold areas.
This shows you the area of reversal for the RSI. Generally, when the indicator falls out of the bands, you'll see a quick reversal. Indeed this is a better way to find the overbought and oversold areas.
Информация о релизе
I have updated this indicator and added some levels to it. These levels are adjustable and you can easily modify them. These levels help you to have a better understanding of the trend strength, buy and sell areas and finding new opportunities. Скрипт с открытым кодом
В истинном духе TradingView автор этого скрипта опубликовал его с открытым исходным кодом, чтобы трейдеры могли понять, как он работает, и проверить на практике. Вы можете воспользоваться им бесплатно, но повторное использование этого кода в публикации регулируется Правилами поведения. Вы можете добавить этот скрипт в избранное и использовать его на графике.
Отказ от ответственности
Все виды контента, которые вы можете увидеть на TradingView, не являются финансовыми, инвестиционными, торговыми или любыми другими рекомендациями. Мы не предоставляем советы по покупке и продаже активов. Подробнее — в Условиях использования TradingView.