OPEN-SOURCE SCRIPT
Daily High and Low Levels Indicator
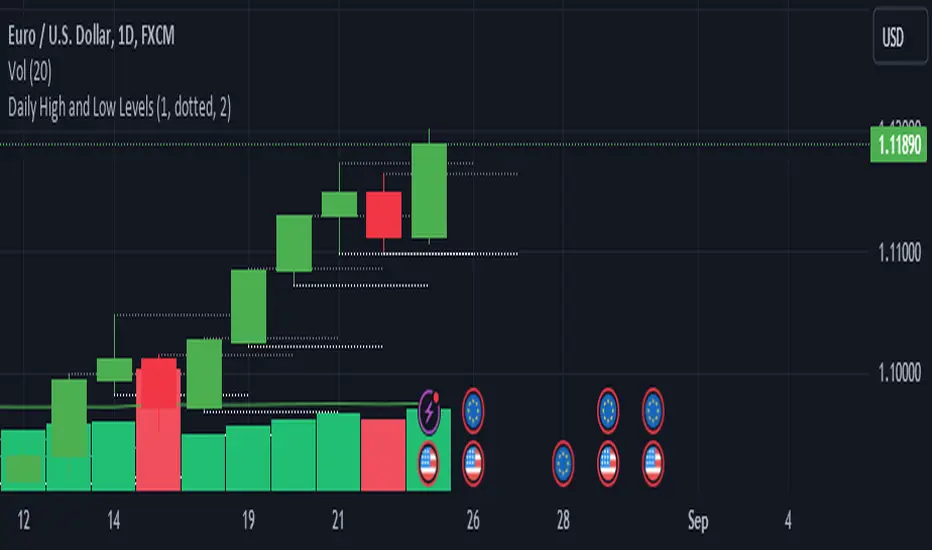
This Pine Script indicator displays horizontal lines representing the high and low levels of the previous trading day, extending them to the right side of the chart for better visibility. It updates automatically at the start of each new trading day.
Features:
Daily High and Low Levels: Marks the high and low levels of the previous day with horizontal lines.
Customization:
Adjust the color, style, and thickness of the lines to fit your preferences.
High Level Line Color: Customize to your preferred color (default: gray).
Low Level Line Color: Customize to your preferred color (default: white).
Line Style Options: Choose between solid, dashed, or dotted lines.
Line Thickness: Adjust the width of the lines.
Extended Lines: Extend the lines to the right side of the chart for enhanced visibility.
Labeling: Shows clear labels "Previous High" and "Previous Low" next to the lines for easy reference.
Usage:
Add this indicator to your chart to visualize the previous day's high and low levels.
Customize the appearance of the lines and labels using the input options.
The indicator will automatically update these levels at the beginning of each trading day.
This indicator is designed to help traders quickly identify significant price levels from the previous day and make informed trading decisions.
License: This script is provided under the Attribution-NonCommercial-ShareAlike 4.0 International (CC BY-NC-SA 4.0) License. For more information, visit Creative Commons License.
Скрипт с открытым кодом
В истинном духе TradingView автор этого скрипта опубликовал его с открытым исходным кодом, чтобы трейдеры могли понять, как он работает, и проверить на практике. Вы можете воспользоваться им бесплатно, но повторное использование этого кода в публикации регулируется Правилами поведения. Вы можете добавить этот скрипт в избранное и использовать его на графике.
Отказ от ответственности
Все виды контента, которые вы можете увидеть на TradingView, не являются финансовыми, инвестиционными, торговыми или любыми другими рекомендациями. Мы не предоставляем советы по покупке и продаже активов. Подробнее — в Условиях использования TradingView.