PROTECTED SOURCE SCRIPT
TraderHouse signals RSI+QQE
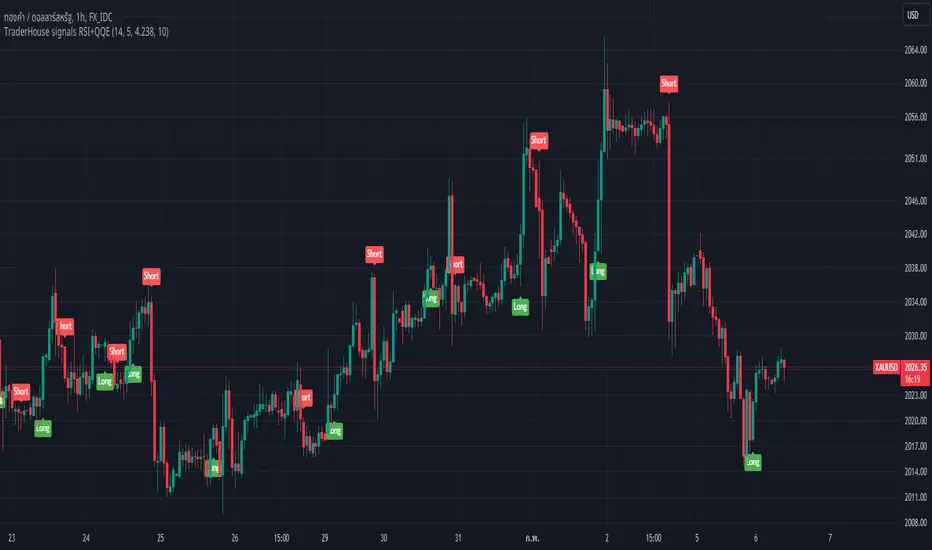
TraderHouse signals RSI+QQE
The Relative Strength Index (RSI), developed by J. Welles Wilder, is a momentum oscillator that measures the speed and change of price movements. The RSI oscillates between zero and 100. Traditionally the RSI is considered overbought when above 70 and oversold when below 30.
The QQE (Quantitative Qualitative Estimation) indicator is based on Welles Wilder’s RSI. QQE is based on a smoothed RSI value that is plotted. The absolute value of the change in smoothed RSI values from bar to bar is calculated and averaged twice. This double-smoothed value is then multiplied by two user-specified constants to create two additional lines (FastTL and SlowTL) that are also plotted.
As a trending indicator, look for the SmoothRSI to cross above or below the 50 level. As an oscillator, much like the RSI it is based on, look for overbought or oversold conditions. Generally greater than 70 is considered overbought, while values less than 30 are considered oversold.
Divergence is another way to use QQE by looking for divergences between the QQE momentum and price momentum.
Отказ от ответственности
Все виды контента, которые вы можете увидеть на TradingView, не являются финансовыми, инвестиционными, торговыми или любыми другими рекомендациями. Мы не предоставляем советы по покупке и продаже активов. Подробнее — в Условиях использования TradingView.