OPEN-SOURCE SCRIPT
Volatility Dashboard
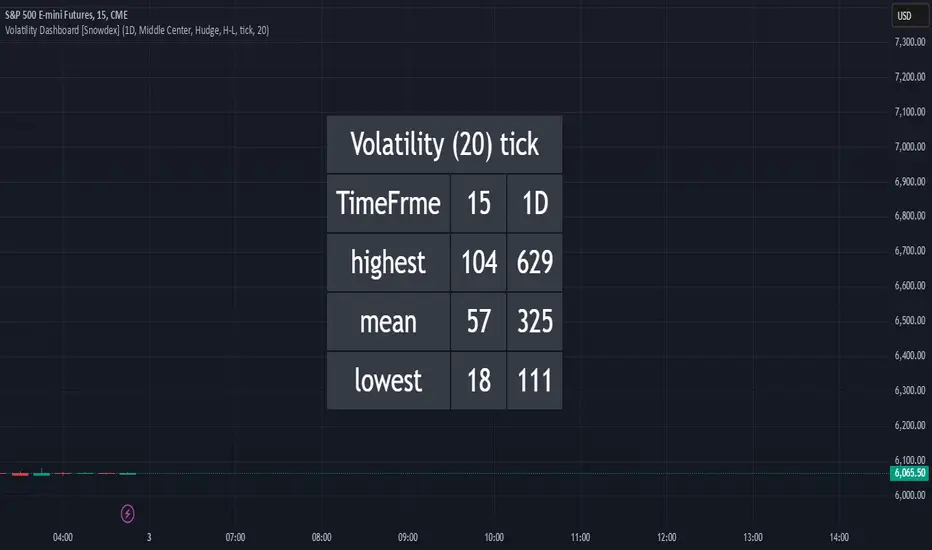
This indicator calculates and displays volatility metrics for a specified number of bars (rolling window) on a TradingView chart. It can be customized to display information in English or Thai and can position the dashboard at various locations on the chart.
Inputs
Display Logic
Inputs
- Language: Users can choose between English ("ENG") and Thai ("TH") for the dashboard's language.
- Dashboard Position: Users can specify where the dashboard should appear on the chart. Options include various positions such as "Bottom Right", "Top Center", etc.
- Calculation Method: Currently, the script supports "High-Low" for volatility calculation. This method calculates the difference between the highest and lowest prices within a specified timeframe.
- Bars: Number of bars used to calculate the volatility.
Display Logic
- Fills the islast_vol_points array with the calculated volatility points.
- Sets the table cells with headers and corresponding values:
=> Highest Volatility: The maximum value in the islast_vol_points array
=> Mean Volatility: The average value in the islast_vol_points array,
=> Lowest Volatility: The minimum value in the islast_vol_points array, Number of Bars: The rolling window size.
Скрипт с открытым кодом
В истинном духе TradingView автор этого скрипта опубликовал его с открытым исходным кодом, чтобы трейдеры могли понять, как он работает, и проверить на практике. Вы можете воспользоваться им бесплатно, но повторное использование этого кода в публикации регулируется Правилами поведения. Вы можете добавить этот скрипт в избранное и использовать его на графике.
Отказ от ответственности
Все виды контента, которые вы можете увидеть на TradingView, не являются финансовыми, инвестиционными, торговыми или любыми другими рекомендациями. Мы не предоставляем советы по покупке и продаже активов. Подробнее — в Условиях использования TradingView.