OPEN-SOURCE SCRIPT
Dominance Pie Chart
Обновлено
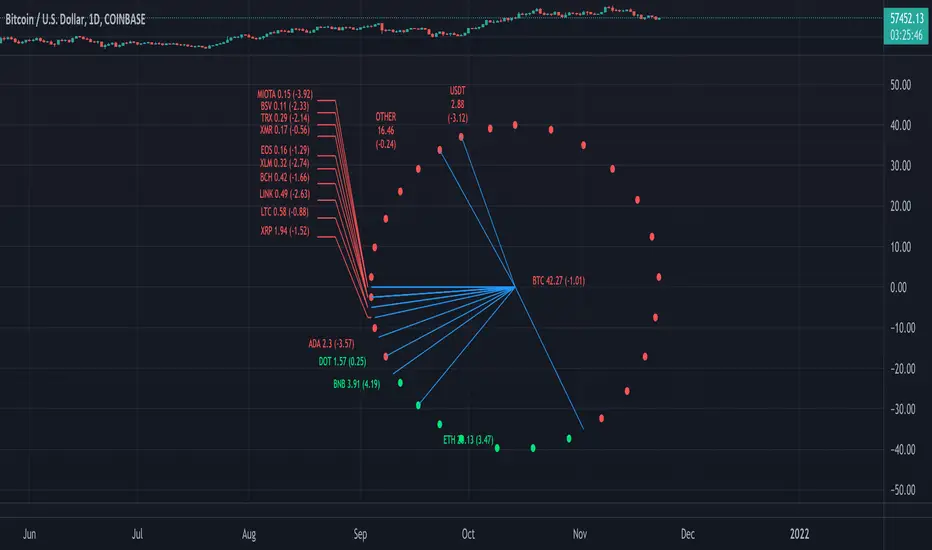
A different type of charting, the pie chart,
here for showing the available dominance on one chart,
together with the total % dominance per ticker and between brackets
the % rise/fall.
Can be used in every timeframe
(It is normal it takes some time to be loaded)
Cheers!
here for showing the available dominance on one chart,
together with the total % dominance per ticker and between brackets
the % rise/fall.
Can be used in every timeframe
(It is normal it takes some time to be loaded)
Cheers!
Информация о релизе
- Added the feature 'ignore_invalid_symbol' https://www.tradingview.com/pine-script-reference/v5/#fun_request{dot}security (with much thanks to Tradingview/Pinecoders!)In the past, the script gave an error when a ticker wasn't available.
Now, when this happens (because of 'ignore_invalid_symbol') the script's execution continues
with the unavailable ticker giving 0.
- Converted to Pinescript v5
Скрипт с открытым кодом
В истинном духе TradingView автор этого скрипта опубликовал его с открытым исходным кодом, чтобы трейдеры могли понять, как он работает, и проверить на практике. Вы можете воспользоваться им бесплатно, но повторное использование этого кода в публикации регулируется Правилами поведения. Вы можете добавить этот скрипт в избранное и использовать его на графике.
LuxAlgo Dev: luxalgo.com
PineCoder: pinecoders.com
- We cannot control our emotions,
but we can control our keyboard -
PineCoder: pinecoders.com
- We cannot control our emotions,
but we can control our keyboard -
Отказ от ответственности
Все виды контента, которые вы можете увидеть на TradingView, не являются финансовыми, инвестиционными, торговыми или любыми другими рекомендациями. Мы не предоставляем советы по покупке и продаже активов. Подробнее — в Условиях использования TradingView.