OPEN-SOURCE SCRIPT
Trend Volume Accumulation R1 by JustUncleL
Обновлено
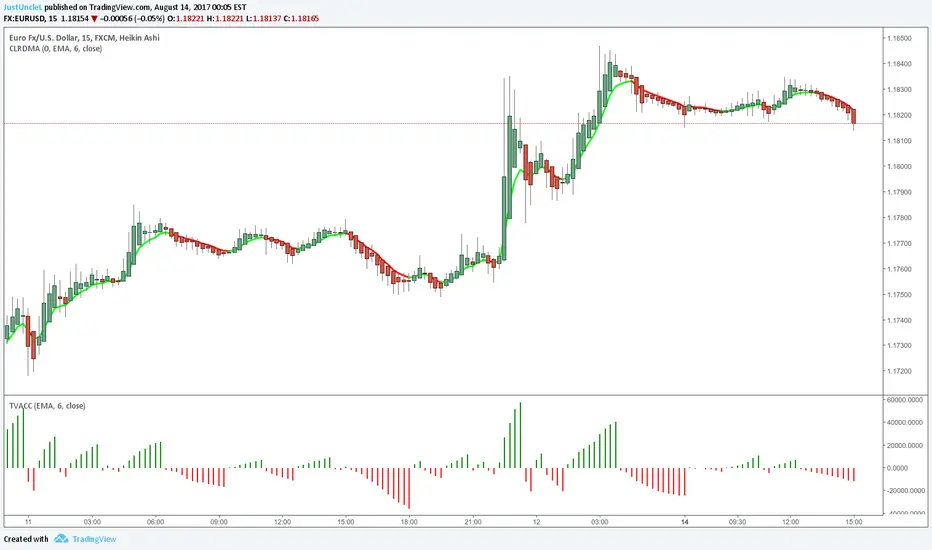
This simple indicator shows the Accumulated Volume within the current uptrend or downtrend. The uptrend/downtrend is detected by a change in direction of the candles which works very well with Heikin Ashi and Renko charts. Alternatively you can use a Moving average direction to indicate trend direction, which should work on any candle type.
You can select between 11 different types of moving average:
Here is a sample chart using EMA length 6 for trend Direction:

You can select between 11 different types of moving average:
- SMA = Simple Moving Average.
- EMA = Exponential Moving Average.
- WMA = Weighted Moving Average
- VWMA = Volume Weighted Moving Average
- SMMA = Smoothed Simple Moving Average.
- DEMA = Double Exponential Moving Average
- TEMA = Triple Exponential Moving Average.
- HullMA = Hull Moving Average
- SSMA = Ehlers Super Smoother Moving average
- ZEMA = Near Zero Lag Exponential Moving Average.
- TMA = Triangular (smoothed) Simple Moving Average.
Here is a sample chart using EMA length 6 for trend Direction:
Информация о релизе
Revision R2:- Added Option to show Running Averaged Volume within the Trend. The average using Bar count since start of trend (Bar Avg) or Time since start of Trend (Time Avg).
- Changed Short name to "TVA" - Trend Volume Accumulation
NOTE: The Running Averaged Volume option "Time Avg" is designed to be used with Renko charts and only works well short brick sizes (<=10pips) + time frames (<=15min) .
Информация о релизе
Missed one in last update.- Added Bar Time Normalised Trend Volume Accumulation option, this is really designed for price bar charts like Renko.
JustUncleL
Скрипт с открытым кодом
В истинном духе TradingView автор этого скрипта опубликовал его с открытым исходным кодом, чтобы трейдеры могли понять, как он работает, и проверить на практике. Вы можете воспользоваться им бесплатно, но повторное использование этого кода в публикации регулируется Правилами поведения. Вы можете добавить этот скрипт в избранное и использовать его на графике.
Отказ от ответственности
Все виды контента, которые вы можете увидеть на TradingView, не являются финансовыми, инвестиционными, торговыми или любыми другими рекомендациями. Мы не предоставляем советы по покупке и продаже активов. Подробнее — в Условиях использования TradingView.