OPEN-SOURCE SCRIPT
Reverse Repo Correlation
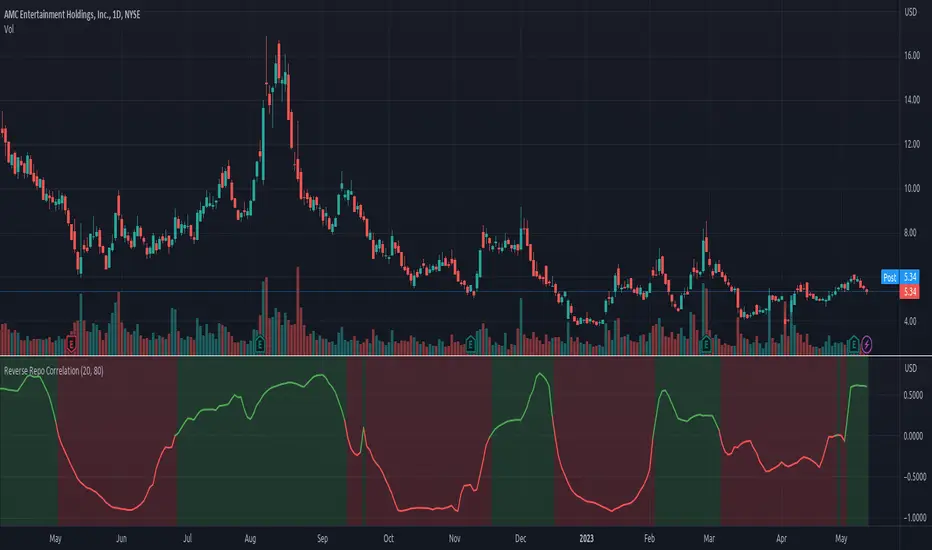
Reverse Repo Correlation Indicator
This TradingView indicator calculates the correlation between the current stock's close price and the value of the Reverse Repo Rate (`RRPONTSYD`). It uses the Pearson correlation coefficient to measure the strength and direction of the relationship.
Inputs
- **Correlation Length**: The number of bars used to calculate the correlation.
- **Background Transparency**: The transparency level (0-100) for the background color indicating positive or negative correlation.
### How it works
1. The indicator retrieves the close price of the current stock and assigns it to the `stockClose` variable.
2. The **Correlation Length** input determines the number of bars used to calculate the correlation.
3. The `pearson_corr` function calculates the Pearson correlation between the `stockClose` and `rrpontsydValue` variables over the specified length.
4. The `rrpontsydValue` is retrieved using the `request.economic` function, which fetches the Reverse Repo Rate value (`RRPONTSYD`) for the "US" economic calendar.
5. The correlation value is plotted on the chart as a line, with positive correlations displayed in green and negative correlations in red.
6. The **Background Transparency** input determines the transparency level of the background color, which changes based on the correlation value. Positive correlations have a green background, while negative correlations have a red background.
Adjust the `correlationLength` and `transparency` inputs as needed.
Скрипт с открытым кодом
В истинном духе TradingView автор этого скрипта опубликовал его с открытым исходным кодом, чтобы трейдеры могли понять, как он работает, и проверить на практике. Вы можете воспользоваться им бесплатно, но повторное использование этого кода в публикации регулируется Правилами поведения. Вы можете добавить этот скрипт в избранное и использовать его на графике.
Отказ от ответственности
Все виды контента, которые вы можете увидеть на TradingView, не являются финансовыми, инвестиционными, торговыми или любыми другими рекомендациями. Мы не предоставляем советы по покупке и продаже активов. Подробнее — в Условиях использования TradingView.