OPEN-SOURCE SCRIPT
S&P Short-Range Oscillator
Обновлено
**SHOULD BE USED ON THE S&P 500 ONLY**
The S&P Short-Range Oscillator (SRO), inspired by the principles of Jim Cramer's oscillator, is a technical analysis tool designed to help traders identify potential buy and sell signals in the stock market, specifically for the S&P 500 index. The SRO combines several market indicators to provide a normalized measure of market sentiment, assisting traders in making informed decisions.
The SRO utilizes two simple moving averages (SMAs) of different lengths: a 5-day SMA and a 10-day SMA. It also incorporates the daily price change and market breadth (the net change of closing prices). The 5-day and 10-day SMAs are calculated based on the closing prices. The daily price change is determined by subtracting the opening price from the closing price. Market breadth is calculated as the difference between the current closing price and the previous closing price.
The raw value of the oscillator, referred to as SRO Raw, is the sum of the daily price change, the 5-day SMA, the 10-day SMA, and the market breadth. This raw value is then normalized using its mean and standard deviation over a 20-day period, ensuring that the oscillator is centered and maintains a consistent scale. Finally, the normalized value is scaled to fit within the range of -15 to 15.
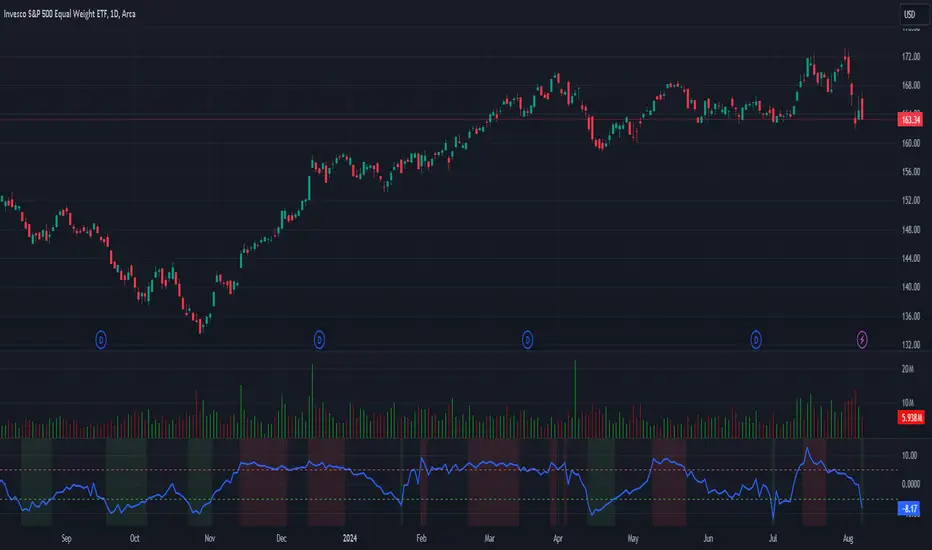
When interpreting the SRO, a value below -5 indicates that the market is potentially oversold, suggesting it might be a good time to start buying stocks as the market could be poised for a rebound. Conversely, a value above 5 suggests that the market is potentially overbought. In this situation, it may be prudent to hold on to existing positions or consider selling if you have substantial gains.
The SRO is visually represented as a blue line on a chart, making it easy to track its movements. Red and green horizontal lines mark the overbought (5) and oversold (-5) levels, respectively. Additionally, the background color changes to light red when the oscillator is overbought and light green when it is oversold, providing a clear visual cue.
By incorporating the S&P Short-Range Oscillator into your trading strategy, you can gain valuable insights into market conditions and make more informed decisions about when to buy, sell, or hold your stocks. However, always consider other market factors and perform your own analysis before making any trading decisions.
The S&P Short-Range Oscillator is a powerful tool for traders looking to gain insights into market sentiment. It provides clear buy and sell signals through its combination of multiple indicators and normalization process. However, traders should be aware of its lagging nature and potential complexity, and use it in conjunction with other analysis methods for the best results.
Disclaimer
The S&P Short-Range Oscillator is for informational purposes only and should not be considered financial advice. Trading involves risk, and you should conduct your own research or consult a financial advisor before making investment decisions. The author is not responsible for any losses incurred from using this indicator. Use at your own risk.
The S&P Short-Range Oscillator (SRO), inspired by the principles of Jim Cramer's oscillator, is a technical analysis tool designed to help traders identify potential buy and sell signals in the stock market, specifically for the S&P 500 index. The SRO combines several market indicators to provide a normalized measure of market sentiment, assisting traders in making informed decisions.
The SRO utilizes two simple moving averages (SMAs) of different lengths: a 5-day SMA and a 10-day SMA. It also incorporates the daily price change and market breadth (the net change of closing prices). The 5-day and 10-day SMAs are calculated based on the closing prices. The daily price change is determined by subtracting the opening price from the closing price. Market breadth is calculated as the difference between the current closing price and the previous closing price.
The raw value of the oscillator, referred to as SRO Raw, is the sum of the daily price change, the 5-day SMA, the 10-day SMA, and the market breadth. This raw value is then normalized using its mean and standard deviation over a 20-day period, ensuring that the oscillator is centered and maintains a consistent scale. Finally, the normalized value is scaled to fit within the range of -15 to 15.
When interpreting the SRO, a value below -5 indicates that the market is potentially oversold, suggesting it might be a good time to start buying stocks as the market could be poised for a rebound. Conversely, a value above 5 suggests that the market is potentially overbought. In this situation, it may be prudent to hold on to existing positions or consider selling if you have substantial gains.
The SRO is visually represented as a blue line on a chart, making it easy to track its movements. Red and green horizontal lines mark the overbought (5) and oversold (-5) levels, respectively. Additionally, the background color changes to light red when the oscillator is overbought and light green when it is oversold, providing a clear visual cue.
By incorporating the S&P Short-Range Oscillator into your trading strategy, you can gain valuable insights into market conditions and make more informed decisions about when to buy, sell, or hold your stocks. However, always consider other market factors and perform your own analysis before making any trading decisions.
The S&P Short-Range Oscillator is a powerful tool for traders looking to gain insights into market sentiment. It provides clear buy and sell signals through its combination of multiple indicators and normalization process. However, traders should be aware of its lagging nature and potential complexity, and use it in conjunction with other analysis methods for the best results.
Disclaimer
The S&P Short-Range Oscillator is for informational purposes only and should not be considered financial advice. Trading involves risk, and you should conduct your own research or consult a financial advisor before making investment decisions. The author is not responsible for any losses incurred from using this indicator. Use at your own risk.
Информация о релизе
The updated code modifies the calculation of market breadth by using an equal-weighted average of the last 10 days, instead of just the net change from the previous day. In the original code, the market breadth is calculated using the difference between the current and previous day's closing prices. This method can result in a more volatile and reactive signal because it only considers the price change from one day to the next.In contrast, the updated code calculates the market breadth by taking the differences in closing prices over the last 10 days and applying an equal weight to each day. This approach smooths out the signal, making it less sensitive to short-term fluctuations and daily market noise. By averaging the changes over a longer period, the indicator becomes more stable and reliable, which can help traders avoid reacting to brief market anomalies and focus on more sustained trends.
Overall, the update provides a more consistent and less volatile indicator, making it better suited for identifying genuine market trends and reducing the likelihood of false signals caused by single-day price movements. This can be particularly beneficial for traders looking to make more informed and stable trading decisions based on a broader range of recent market data.
Информация о релизе
The new code introduces the calculation of the McClellan Oscillator by incorporating two exponential moving averages (EMAs) with specified lengths, which enhances the indicator by including broader market momentum. This addition allows the oscillator to reflect not only price changes but also underlying market trends, making it more comprehensive and sensitive to significant market movements.Furthermore, the market breadth calculation has been refined by employing an equal-weighted approach over the last 10 days, instead of using a simple net change of closing prices. This method provides a more balanced and representative view of market conditions over a short period, ensuring that no single day disproportionately affects the breadth calculation. By averaging the market breadth across multiple days, the indicator becomes less susceptible to short-term fluctuations and anomalies.
Additionally, the use of the equal-weighted S&P 500 index is incorporated into the breadth calculation. The equal-weighted approach gives each stock in the S&P 500 the same importance, rather than weighting them by market capitalization. This results in a broader and more accurate representation of the overall market's performance, as it reduces the influence of larger companies and better captures the performance of smaller and mid-sized firms. This method ensures a more democratic view of market breadth and enhances the reliability of the oscillator.
These improvements result in a smoother and more reliable oscillator, which helps to drown out market noise and deliver clearer signals for traders. The combined effect of incorporating broader market momentum, refining market breadth calculation, and using the equal-weighted S&P 500 enhances the overall accuracy and usability of the oscillator, making it a more effective tool for technical analysis. By providing a more balanced and comprehensive view of market conditions, traders can make better-informed decisions based on the indicator's signals.
Скрипт с открытым кодом
В истинном духе TradingView автор этого скрипта опубликовал его с открытым исходным кодом, чтобы трейдеры могли понять, как он работает, и проверить на практике. Вы можете воспользоваться им бесплатно, но повторное использование этого кода в публикации регулируется Правилами поведения. Вы можете добавить этот скрипт в избранное и использовать его на графике.
Отказ от ответственности
Все виды контента, которые вы можете увидеть на TradingView, не являются финансовыми, инвестиционными, торговыми или любыми другими рекомендациями. Мы не предоставляем советы по покупке и продаже активов. Подробнее — в Условиях использования TradingView.