PROTECTED SOURCE SCRIPT
Обновлено [INVX] P/E band (panel)
What is it?
Why P/E Bollinger Band?
Who should use it
How to use
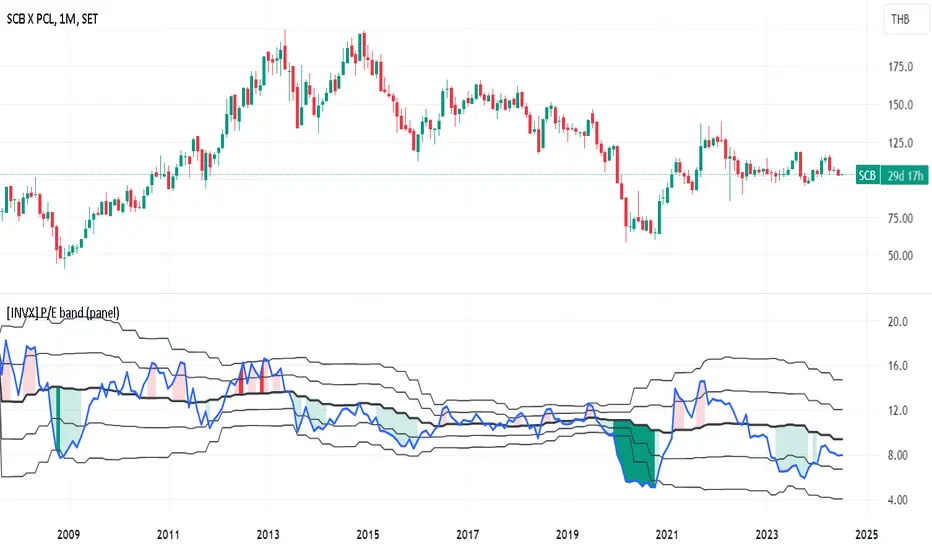
- The P/E Bollinger Band indicator is a hybrid tool combining fundamental analysis (P/E ratio) with technical analysis (Bollinger Bands).
- It uses Bollinger Bands around a company's P/E ratio to identify potentially overvalued or undervalued zones.
- The P/E ratio itself measures a stock's price relative to its earnings per share.
- The Bollinger Bands, based on standard deviations, create a dynamic upper and lower band around the average P/E ratio.
Why P/E Bollinger Band?
- Provides a visual representation of a company's relative valuation compared to its historical P/E range.
- Can help identify areas where the P/E ratio might be deviating significantly from its historical norm.
Who should use it
- Investors who combine technical and fundamental analysis for a more comprehensive stock evaluation.
- Value investors seeking to identify potentially undervalued companies.
How to use
- A P/E value that breaches the upper Bollinger Band suggests potential overvaluation, indicating the stock might be due for a price correction.
- Conversely, a P/E value that falls below the lower Bollinger Band might signal undervaluation, presenting a potential buying opportunity (considering the company's fundamentals remain sound).
Информация о релизе
What is it?- The P/E Bollinger Band indicator is a hybrid tool combining fundamental analysis (P/E ratio) with technical analysis (Bollinger Bands).
- It uses Bollinger Bands around a company's P/E ratio to identify potentially overvalued or undervalued zones.
- The P/E ratio itself measures a stock's price relative to its earnings per share.
- The Bollinger Bands, based on standard deviations, create a dynamic upper and lower band around the average P/E ratio.
Why P/E Bollinger Band?
- Provides a visual representation of a company's relative valuation compared to its historical P/E range.
- Can help identify areas where the P/E ratio might be deviating significantly from its historical norm.
Who should use it
- Investors who combine technical and fundamental analysis for a more comprehensive stock evaluation.
- Value investors seeking to identify potentially undervalued companies.
How to use
- A P/E value that breaches the upper Bollinger Band suggests potential overvaluation, indicating the stock might be due for a price correction.
- Conversely, a P/E value that falls below the lower Bollinger Band might signal undervaluation, presenting a potential buying opportunity (considering the company's fundamentals remain sound).
Скрипт с защищённым кодом
Этот скрипт опубликован с закрытым исходным кодом. Однако вы можете использовать его свободно и без каких-либо ограничений — читайте подробнее здесь.
Отказ от ответственности
Все виды контента, которые вы можете увидеть на TradingView, не являются финансовыми, инвестиционными, торговыми или любыми другими рекомендациями. Мы не предоставляем советы по покупке и продаже активов. Подробнее — в Условиях использования TradingView.