OPEN-SOURCE SCRIPT
EMA Volume [MacroGlide]

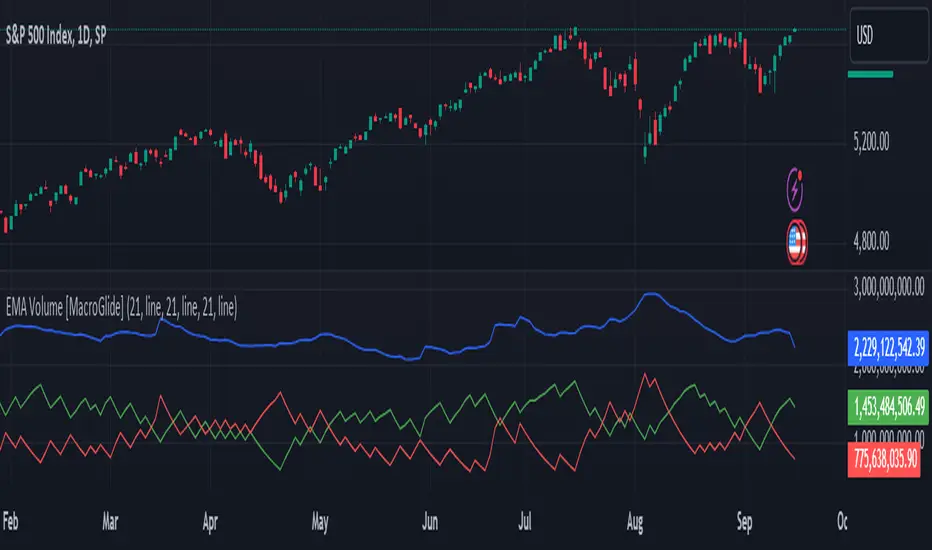
EMA Volume [MacroGlide] is a versatile tool designed to track and analyze market volumes by calculating the Exponential Moving Averages (EMAs) of total, bullish, and bearish volumes. This indicator helps traders visualize volume dynamics, identify buying and selling pressure, and make informed trading decisions based on volume activity.
Key Features:
• Volume EMAs: The indicator calculates the EMAs of total, bullish, and bearish volumes, allowing users to observe how volume trends evolve over time. This helps identify shifts in market sentiment and potential reversals.
• Separation of Bullish and Bearish Volumes: By separating bullish and bearish volumes, the indicator provides a clear view of buying versus selling activity. This distinction is valuable for understanding the market's underlying momentum and direction.
• Customizable Visuals: Users can customize the line style and color for each volume type, allowing them to tailor the display of the indicator to their personal preferences and enhance the visual interpretation of the data.
How to Use:
• Add the indicator to your chart and adjust the EMA settings and display parameters according to your needs.
• Use the difference between bullish and bearish volumes to assess current market sentiment and analyze potential trend changes.
• Monitor the EMA of total volume to identify overall volume trends that can serve as additional signals for entering or exiting positions.
Methodology:
The indicator calculates the EMAs for total, bullish, and bearish volumes based on the trading volumes associated with price increases or decreases. This tool helps evaluate the strength of buying and selling at different times, making it especially useful for volume and market dynamics analysis.
Originality and Usefulness:
EMA Volume [MacroGlide] stands out for its ability to separate buying and selling volumes and present them in a clear visual format, significantly simplifying the analysis of market activity and decision-making in trading.
Charts:
The indicator displays clean and clear charts, where each type of volume is represented by its own line and color, making visual interpretation easier. The charts focus solely on key information for analysis: EMAs of total, bullish, and bearish volumes. These features make the charts highly useful for quick analysis and trading decision-making.
Enjoy the game!
Скрипт с открытым кодом
В истинном духе TradingView автор этого скрипта опубликовал его с открытым исходным кодом, чтобы трейдеры могли понять, как он работает, и проверить на практике. Вы можете воспользоваться им бесплатно, но повторное использование этого кода в публикации регулируется Правилами поведения. Вы можете добавить этот скрипт в избранное и использовать его на графике.
Отказ от ответственности
Все виды контента, которые вы можете увидеть на TradingView, не являются финансовыми, инвестиционными, торговыми или любыми другими рекомендациями. Мы не предоставляем советы по покупке и продаже активов. Подробнее — в Условиях использования TradingView.