OPEN-SOURCE SCRIPT
Relative Volume Strength Index
Обновлено
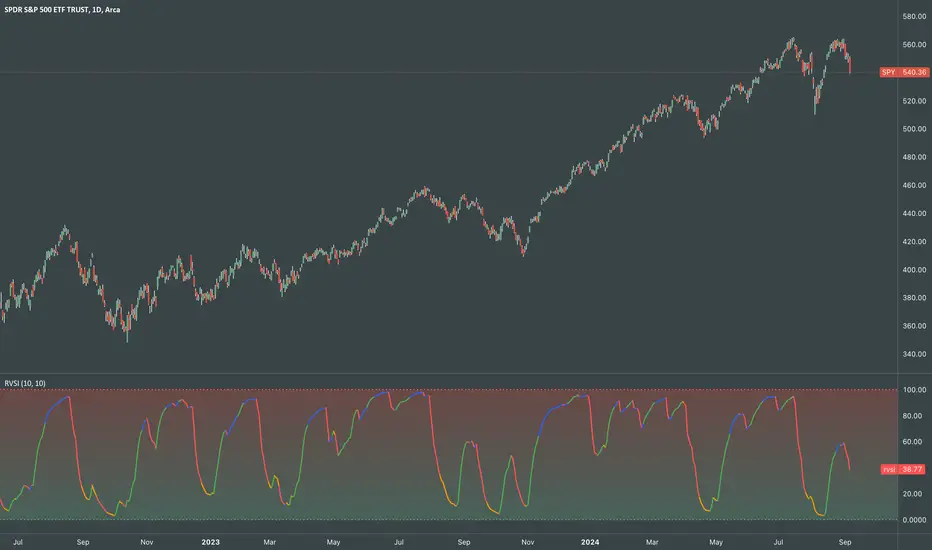
RVSI is an alternative volume-based indicator that measures the rate of change of average OBV.
How to read a chart using it?
It looks simple, but it's powerful!
I'd use RVSI in combination with price-based indicators.
How to read a chart using it?
- First signal to buy is when you see RVSI is close to green oversold levels.
- Once RVSI passes above it's orange EMA, that would be the second alert of accumulation.
- Be always cautious when it reaches 50 level as a random statistical correction can be expected because of "market noises".
- You know it's a serious uptrend when it reaches above 75 and fluctuates there, grading behind EMA.
- The best signal to sell would be a situation where you see RVSI passing below it's EMA when the whole thing is close to Red overbought level
It looks simple, but it's powerful!
I'd use RVSI in combination with price-based indicators.
Информация о релизе
Update:Added visual intuitiveness
Информация о релизе
updИнформация о релизе
Effective increase in responsiveness due to a slight change in formula.Информация о релизе
- Color-coded rate of change relative to its linear regression
- Changed formula to enhance the responsiveness
🏛️🌐
Скрипт с открытым кодом
В истинном духе TradingView автор этого скрипта опубликовал его с открытым исходным кодом, чтобы трейдеры могли понять, как он работает, и проверить на практике. Вы можете воспользоваться им бесплатно, но повторное использование этого кода в публикации регулируется Правилами поведения. Вы можете добавить этот скрипт в избранное и использовать его на графике.
Отказ от ответственности
Все виды контента, которые вы можете увидеть на TradingView, не являются финансовыми, инвестиционными, торговыми или любыми другими рекомендациями. Мы не предоставляем советы по покупке и продаже активов. Подробнее — в Условиях использования TradingView.