OPEN-SOURCE SCRIPT
Titans Price Incidence
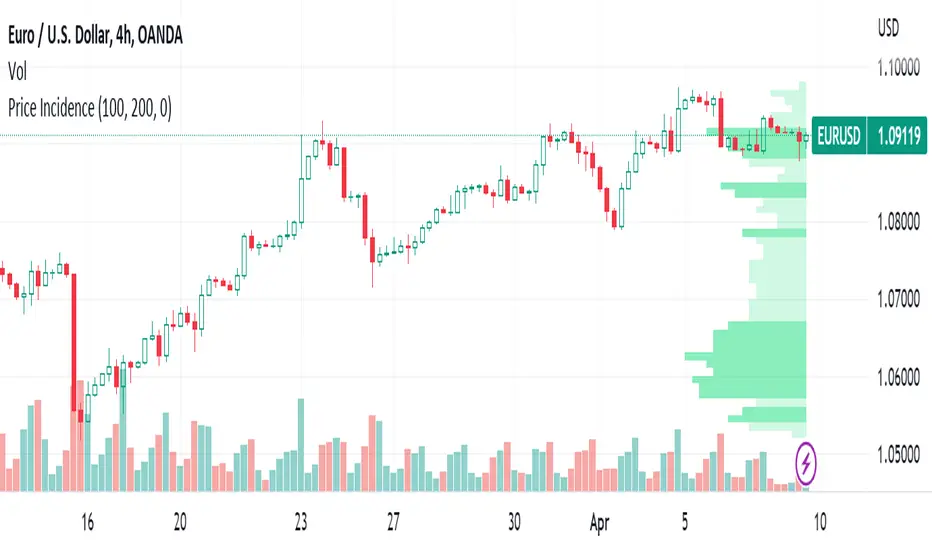
The Titans Price Incidence indicator is set to display the historical incidence of highs and lows at each price level.
A longer bar indicates a higher occurrence of highs and lows at that price level.
The interval of each price level is determined by a user-defined "degree", which is a multiple of the counter's minimum tick.
For example, a counter with a minimum tick of 0.00001 and a degree of 200 will result in a price interval of 0.002.
As another example, a counter with a minimum tick of 0.001 and a degree of 10000 will result in a price interval of 10.
For convenience the minimum tick of the counter is included as a plot.
The historical period to study is based on a user-defined "lookback", which is the number of candles to look back over.
Finally it is possible to review the indicator display at a certain candle in the past by entering a "reference".
To display the current price incidence, a reference of 0 should be used.
Скрипт с открытым кодом
В истинном духе TradingView автор этого скрипта опубликовал его с открытым исходным кодом, чтобы трейдеры могли понять, как он работает, и проверить на практике. Вы можете воспользоваться им бесплатно, но повторное использование этого кода в публикации регулируется Правилами поведения. Вы можете добавить этот скрипт в избранное и использовать его на графике.
Отказ от ответственности
Все виды контента, которые вы можете увидеть на TradingView, не являются финансовыми, инвестиционными, торговыми или любыми другими рекомендациями. Мы не предоставляем советы по покупке и продаже активов. Подробнее — в Условиях использования TradingView.