OPEN-SOURCE SCRIPT
VWAP with RSI
VWAP with RSI Indicator
Overview
The VWAP with RSI Indicator is a powerful tool that combines the Volume Weighted Average Price (VWAP) with the Relative Strength Index (RSI) to provide traders with comprehensive insights into price trends, volume-weighted price levels, and market momentum. This dual-indicator setup enhances your trading strategy by offering a clearer understanding of the market conditions, potential entry and exit points, and trend reversals.
Key Features
VWAP (Volume Weighted Average Price):
Calculation: The VWAP is calculated using the high, low, and close prices, weighted by trading volume over a specified period.
Purpose: VWAP provides an average price that reflects the trading volume at different price levels, helping traders identify the true average price over a given period.
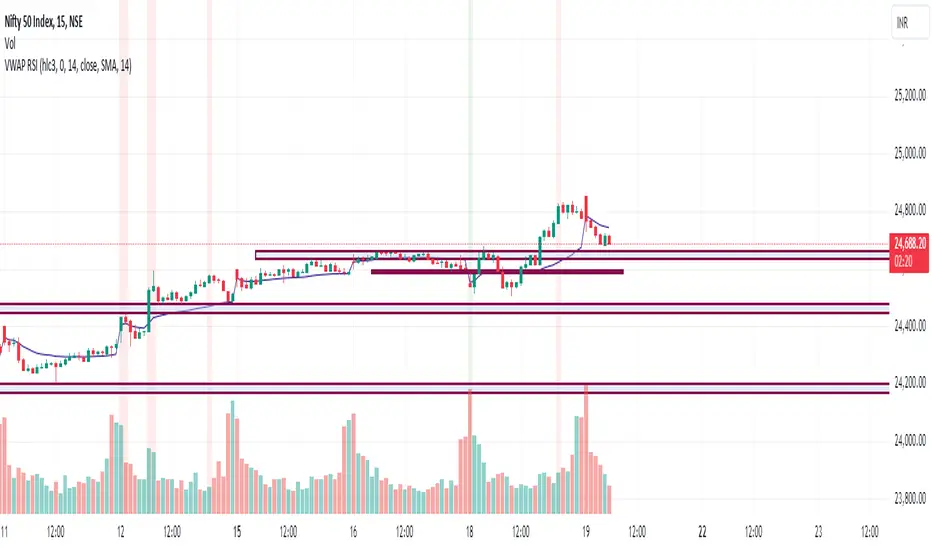
Visualization: The VWAP line is plotted in blue on the price chart, indicating the volume-weighted average price.
RSI (Relative Strength Index):
Calculation: RSI is based on the average gains and losses over a specified period (default is 14 periods) and ranges from 0 to 100.
Purpose: RSI measures the speed and change of price movements, identifying overbought or oversold conditions in the market.
Overbought/Oversold Levels:
Overbought: RSI above 70 (red line).
Oversold: RSI below 30 (green line).
Midline: RSI at 50 (gray dashed line).
Visualization: The RSI line changes color based on its value (purple for normal, red for overbought, green for oversold) and is plotted below the price chart.
Background Fill for RSI:
Overbought Area: Shaded red when RSI is above 70.
Oversold Area: Shaded green when RSI is below 30.
Bullish and Bearish Divergence Detection:
Bullish Divergence: Occurs when price forms a lower low, but RSI forms a higher low, indicating potential upward reversal.
Visualization: Bullish divergence points are marked with a green line and labeled "Bull."
Bearish Divergence: Occurs when price forms a higher high, but RSI forms a lower high, indicating potential downward reversal.
Visualization: Bearish divergence points are marked with a red line and labeled "Bear."
Alerts: Conditions for bullish and bearish divergences trigger alerts.
Settings
VWAP Settings:
hideonDWM: Option to hide VWAP on daily or higher timeframes.
src: Source for VWAP calculation (default is hlc3 - (high + low + close)/3).
offset: Offset for plotting the VWAP.
RSI Settings:
rsiLengthInput: Period length for RSI calculation (default is 14).
rsiSourceInput: Source for RSI calculation (default is close price).
maTypeInput: Type of moving average applied to RSI (options: SMA, EMA).
maLengthInput: Length of the moving average applied to RSI.
How to Use
Trend Identification: Use VWAP to identify the average price level and market trend. If the price is above VWAP, it suggests an uptrend, and if below, it suggests a downtrend.
Overbought/Oversold Conditions: Use RSI to identify potential reversal points. RSI above 70 indicates overbought conditions, and below 30 indicates oversold conditions.
Divergence: Look for bullish or bearish divergences between price and RSI to anticipate potential trend reversals.
Conclusion
By combining VWAP and RSI, this indicator provides a robust framework for analyzing market conditions, identifying trends, and making more informed trading decisions. Enhance your trading strategy today with the VWAP with RSI Indicator!
Overview
The VWAP with RSI Indicator is a powerful tool that combines the Volume Weighted Average Price (VWAP) with the Relative Strength Index (RSI) to provide traders with comprehensive insights into price trends, volume-weighted price levels, and market momentum. This dual-indicator setup enhances your trading strategy by offering a clearer understanding of the market conditions, potential entry and exit points, and trend reversals.
Key Features
VWAP (Volume Weighted Average Price):
Calculation: The VWAP is calculated using the high, low, and close prices, weighted by trading volume over a specified period.
Purpose: VWAP provides an average price that reflects the trading volume at different price levels, helping traders identify the true average price over a given period.
Visualization: The VWAP line is plotted in blue on the price chart, indicating the volume-weighted average price.
RSI (Relative Strength Index):
Calculation: RSI is based on the average gains and losses over a specified period (default is 14 periods) and ranges from 0 to 100.
Purpose: RSI measures the speed and change of price movements, identifying overbought or oversold conditions in the market.
Overbought/Oversold Levels:
Overbought: RSI above 70 (red line).
Oversold: RSI below 30 (green line).
Midline: RSI at 50 (gray dashed line).
Visualization: The RSI line changes color based on its value (purple for normal, red for overbought, green for oversold) and is plotted below the price chart.
Background Fill for RSI:
Overbought Area: Shaded red when RSI is above 70.
Oversold Area: Shaded green when RSI is below 30.
Bullish and Bearish Divergence Detection:
Bullish Divergence: Occurs when price forms a lower low, but RSI forms a higher low, indicating potential upward reversal.
Visualization: Bullish divergence points are marked with a green line and labeled "Bull."
Bearish Divergence: Occurs when price forms a higher high, but RSI forms a lower high, indicating potential downward reversal.
Visualization: Bearish divergence points are marked with a red line and labeled "Bear."
Alerts: Conditions for bullish and bearish divergences trigger alerts.
Settings
VWAP Settings:
hideonDWM: Option to hide VWAP on daily or higher timeframes.
src: Source for VWAP calculation (default is hlc3 - (high + low + close)/3).
offset: Offset for plotting the VWAP.
RSI Settings:
rsiLengthInput: Period length for RSI calculation (default is 14).
rsiSourceInput: Source for RSI calculation (default is close price).
maTypeInput: Type of moving average applied to RSI (options: SMA, EMA).
maLengthInput: Length of the moving average applied to RSI.
How to Use
Trend Identification: Use VWAP to identify the average price level and market trend. If the price is above VWAP, it suggests an uptrend, and if below, it suggests a downtrend.
Overbought/Oversold Conditions: Use RSI to identify potential reversal points. RSI above 70 indicates overbought conditions, and below 30 indicates oversold conditions.
Divergence: Look for bullish or bearish divergences between price and RSI to anticipate potential trend reversals.
Conclusion
By combining VWAP and RSI, this indicator provides a robust framework for analyzing market conditions, identifying trends, and making more informed trading decisions. Enhance your trading strategy today with the VWAP with RSI Indicator!
Скрипт с открытым кодом
В истинном духе TradingView автор этого скрипта опубликовал его с открытым исходным кодом, чтобы трейдеры могли понять, как он работает, и проверить на практике. Вы можете воспользоваться им бесплатно, но повторное использование этого кода в публикации регулируется Правилами поведения. Вы можете добавить этот скрипт в избранное и использовать его на графике.
Отказ от ответственности
Все виды контента, которые вы можете увидеть на TradingView, не являются финансовыми, инвестиционными, торговыми или любыми другими рекомендациями. Мы не предоставляем советы по покупке и продаже активов. Подробнее — в Условиях использования TradingView.