PROTECTED SOURCE SCRIPT
Super Synchronicity x Musa Money
Обновлено
The goal of this indicator is to display a simple and easy method that gives traders a logical strategy that can be applied in many different ways.
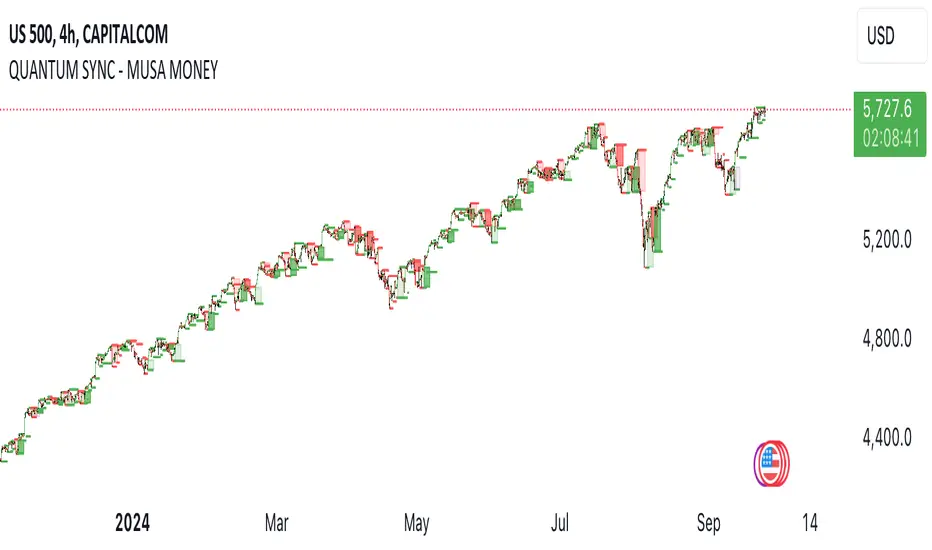
This indicator uses fractal support and resistance created by close above or close below candle structures. This indicator displays sell/buy boxes that represents entries and take profit levels. It also shows multi-timeframe breakouts and structure points. In an buy box (green) the bottom of the box symbolizes the stop loss and the top of the box symbolizes the buy entry. In a sell box (red) the bottom of the box symbolizes the entry and the top of the box symbolizes the stop loss. The lines drawn are support and resistance areas on current and higher timeframe showing market structure and trend.
How to use it:
You must choose a higher timeframe and a lower timeframe. The lower timeframe will be in synchronicity with the higher timeframes trend. The boxes that appear will either be green or red depending on the higher timeframes trend. These boxes will represent your entries. The lavender boxes represents your exit. The dark colored boxes represents a higher probability trade than the light colored boxes bases on market structure (higher highs and higher lows or lower higher and lower lows).
Информация о релизе
This indicator uses timeframe synchronization and support and resistance created by close above or close below candle structures. This indicator displays sell/buy boxes that follows the higher timeframes trend. It also shows multi-timeframe breakouts and structure points. In a buy box (green) the bottom of the box symbolizes the stop loss and the top of the box symbolizes the buy entry. In a sell box (red) the bottom of the box symbolizes the entry and the top of the box symbolizes the stop loss. The lines drawn are support and resistance areas on current and higher timeframe showing market structure and trend.How to use it:
You must choose a higher timeframe and a lower timeframe. The lower timeframe will be in synchronicity with the higher timeframes trend. The boxes that appear will either be green or red depending on the higher timeframes trend. These boxes will represent your entries. The lavender boxes represents small pullbacks in the trend. The dark colored boxes (green or red) represents a higher probability trade than the light colored boxes bases on market structure (higher highs and higher lows or lower higher and lower lows).
Отказ от ответственности
Все виды контента, которые вы можете увидеть на TradingView, не являются финансовыми, инвестиционными, торговыми или любыми другими рекомендациями. Мы не предоставляем советы по покупке и продаже активов. Подробнее — в Условиях использования TradingView.