INVITE-ONLY SCRIPT
dize Automatic Support and Resistance
Обновлено
Hi Trader,
the "Automatic Support and Resistance" indicator is one part of our holistic approach to identifying trading setups. It is one of many indcators of our dize indicator package and should always be used in conjunction with the other dize indicators.
💡 What is the Automatic Support and Resistance indicator?
The "Support and Resistance" indicator calculates support and resistance zones based on our proprietary algorithm. It is a "Price Action" indicator where the market behavior is decisive. You can choose between 5 modes for the calculation of the respective zones - swing, volume point-of-control, price point-of-control, closing or average prices. Each mode builds a unique underlying dataset to calculate the support and resistance levels.
Note: The support and resistance level will be recalculated on each candle to keep them accurate. It can therefore repaint those levels or print new levels as time progresses. That is an intended feature.
💡How to use it?
Looking at the settings, the "Depth" and "Resolution" parameter come into play, when you use the "Volume POC" or the "Price POC" mode. Please be aware, that the resolution should always be smaller than the selected timeframe displayed on your chart. The Depth parameter determines how precise the calculation for the volume POC and price POC levels will be. A higher number means smaller cluster and therefore more precise values.
The "Number of data points"-parameter can be used to specify how far the indicator should look into the history for calculating the zones. While the "Mode" decides how the underlaying dataset will be interpreted. Our calculation method is unique and therefore so powerful. Due to a continuous calculation, the indicator always shows the zones accurately, so that the zones have a great significance.
In addition to the settings for the calculation, there are also settings that affect the visualization. The display can be changed using the "Show Level" checkbox, switching between the "Level"- and the "Box"-mode. Based on the positioning of the closing price to the respective support or resistance zone, the indicator colors the zone using the colors specified in the settings.
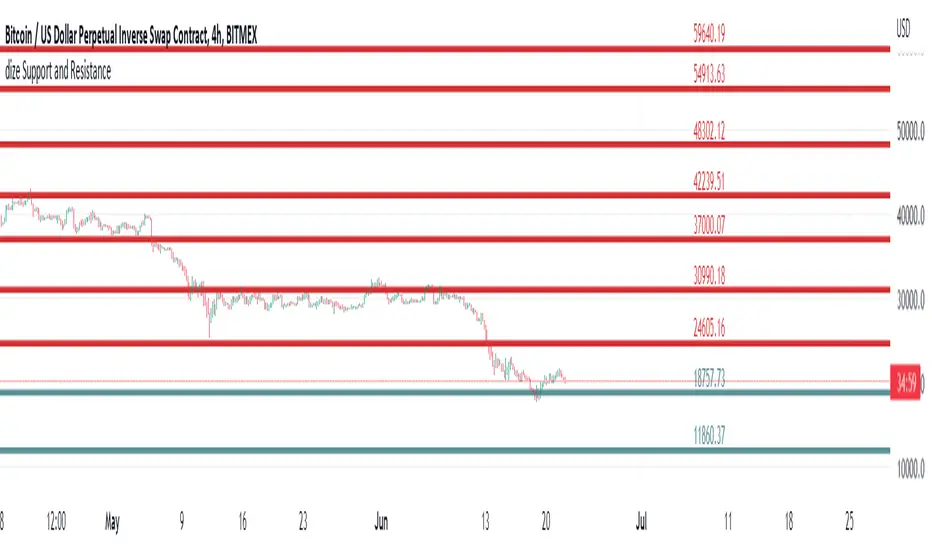
Let's have a look how we can use the Suport and Resistance indicator to our advantage:

As you can see the price hit the displayed support and resistance level multiple times. The above example is one of many use cases for the power index indicator.
🔓 To gain access to this indicator, please read the signature field.
the "Automatic Support and Resistance" indicator is one part of our holistic approach to identifying trading setups. It is one of many indcators of our dize indicator package and should always be used in conjunction with the other dize indicators.
💡 What is the Automatic Support and Resistance indicator?
The "Support and Resistance" indicator calculates support and resistance zones based on our proprietary algorithm. It is a "Price Action" indicator where the market behavior is decisive. You can choose between 5 modes for the calculation of the respective zones - swing, volume point-of-control, price point-of-control, closing or average prices. Each mode builds a unique underlying dataset to calculate the support and resistance levels.
Note: The support and resistance level will be recalculated on each candle to keep them accurate. It can therefore repaint those levels or print new levels as time progresses. That is an intended feature.
💡How to use it?
Looking at the settings, the "Depth" and "Resolution" parameter come into play, when you use the "Volume POC" or the "Price POC" mode. Please be aware, that the resolution should always be smaller than the selected timeframe displayed on your chart. The Depth parameter determines how precise the calculation for the volume POC and price POC levels will be. A higher number means smaller cluster and therefore more precise values.
The "Number of data points"-parameter can be used to specify how far the indicator should look into the history for calculating the zones. While the "Mode" decides how the underlaying dataset will be interpreted. Our calculation method is unique and therefore so powerful. Due to a continuous calculation, the indicator always shows the zones accurately, so that the zones have a great significance.
In addition to the settings for the calculation, there are also settings that affect the visualization. The display can be changed using the "Show Level" checkbox, switching between the "Level"- and the "Box"-mode. Based on the positioning of the closing price to the respective support or resistance zone, the indicator colors the zone using the colors specified in the settings.
Let's have a look how we can use the Suport and Resistance indicator to our advantage:
As you can see the price hit the displayed support and resistance level multiple times. The above example is one of many use cases for the power index indicator.
🔓 To gain access to this indicator, please read the signature field.
Информация о релизе
Added price labels to each lineСкрипт с ограниченным доступом
Доступ к этому скрипту разрешён только для пользователей, авторизованных автором, и для этого обычно требуется оплата. Вы можете добавить скрипт в список избранных, но использовать его можно будет только после запроса на доступ и получения разрешения от автора. Свяжитесь с paaax, чтобы узнать больше, или следуйте инструкциям автора ниже.
TradingView does not suggest paying for a script and using it unless you 100% trust its author and understand how the script works. In many cases, you can find a good open-source alternative for free in our Community Scripts.
Инструкции от автора
″🔓To gain access to the dize indicator package, please subscribe on our website http://www.dize-trading.de
🔒For trial access please follow the instructions on our discord: https://discord.gg/DqwKjBZ8Qe
Хотите использовать этот скрипт на графике?
Внимание: прочтите это перед тем, как запросить доступ.
🙋♂️Listed as "Trusted Pine Programmer for Hire"
💰Save $30 on your Tradingview subscription: bit.ly/3OtLyNz
🔓Indicator access: dize-trading.de/
🔒Trial access: discord.gg/DqwKjBZ8Qe
💰Save $30 on your Tradingview subscription: bit.ly/3OtLyNz
🔓Indicator access: dize-trading.de/
🔒Trial access: discord.gg/DqwKjBZ8Qe
Отказ от ответственности
Все виды контента, которые вы можете увидеть на TradingView, не являются финансовыми, инвестиционными, торговыми или любыми другими рекомендациями. Мы не предоставляем советы по покупке и продаже активов. Подробнее — в Условиях использования TradingView.