PROTECTED SOURCE SCRIPT
Trend of On-Balance-Volume
I use indicators to manage my risks in trading. I don't share the source code because learning how to code is as easy as learning a foreign language.
This Trend of On-Balance-Volume [Trend(OBV)] indicator focuses on analyze "On-Balance-Volume", which measures buying and selling pressure as a cumulative indicator. The mathematical model behind the Trend of On-Balance-Volume [Trend(OBV)] comes from True Strength Index (TSI), developed by William Blau. If you want to learn more TSI or OBV, google the term.
How to read this Trend(OBV)?
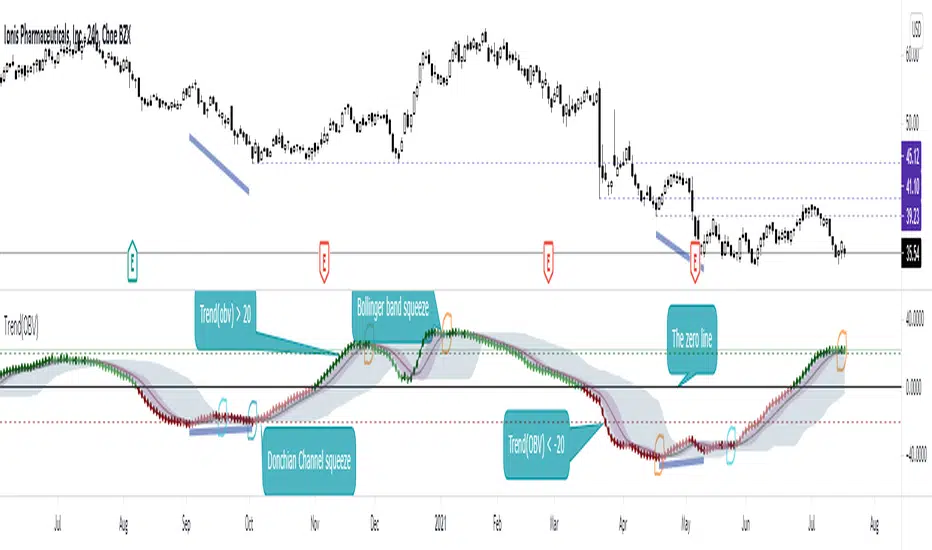
The zero line defines the overall bias. The bullish volume flow has the momentum edge when Trend(OBV) is positive; and the bearish volume flow has the edge when it's negative. The volume flow is very bullish when Trend(OBV) first crosses above 20 directly from the negative zone. Oppositely, The volume flow is very bearish when Trend(OBV) first crosses below "-20" directly from the positive zone.
I use a Bollinger band and Donchian Channel as signals for Trend(OBV). The squeezes from the signaling Bollinger Band and Donchian Channel can be used to plan for significant moves and/or trend reversals.
You can often draw trend lines, support lines and resistance lines directly on Trend(OBV). These can then be used to generate signals based on breakouts and breakdowns. As with all indicators, TSI signals should be confirmed with other indicators and analysis techniques.
This Trend of On-Balance-Volume [Trend(OBV)] indicator focuses on analyze "On-Balance-Volume", which measures buying and selling pressure as a cumulative indicator. The mathematical model behind the Trend of On-Balance-Volume [Trend(OBV)] comes from True Strength Index (TSI), developed by William Blau. If you want to learn more TSI or OBV, google the term.
How to read this Trend(OBV)?
The zero line defines the overall bias. The bullish volume flow has the momentum edge when Trend(OBV) is positive; and the bearish volume flow has the edge when it's negative. The volume flow is very bullish when Trend(OBV) first crosses above 20 directly from the negative zone. Oppositely, The volume flow is very bearish when Trend(OBV) first crosses below "-20" directly from the positive zone.
I use a Bollinger band and Donchian Channel as signals for Trend(OBV). The squeezes from the signaling Bollinger Band and Donchian Channel can be used to plan for significant moves and/or trend reversals.
You can often draw trend lines, support lines and resistance lines directly on Trend(OBV). These can then be used to generate signals based on breakouts and breakdowns. As with all indicators, TSI signals should be confirmed with other indicators and analysis techniques.
Отказ от ответственности
Все виды контента, которые вы можете увидеть на TradingView, не являются финансовыми, инвестиционными, торговыми или любыми другими рекомендациями. Мы не предоставляем советы по покупке и продаже активов. Подробнее — в Условиях использования TradingView.