OPEN-SOURCE SCRIPT
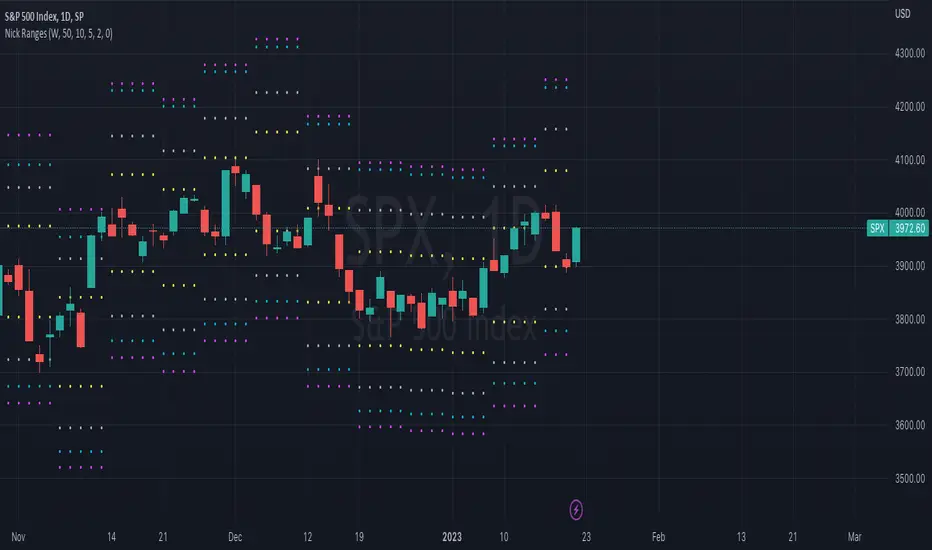
Nick_OS Ranges
Обновлено
UNDERSTANDING THE SCRIPT:
TIMEFRAME RESOLUTION:
* You have the option to choose Daily [D], Weekly [W], or Monthly [M]
LOOKBACK WINDOW:
* This number represents how far back you want the data to pull from
- Example: "250" would represent the past 250 Days, Weeks, or Months depending on what is selected in the Timeframe Resolution
RANGE 1 nth (Gray lines):
* This number represents the range of the nth biggest day, week, or month in the Lookback Window
- Example: "30" would represent the range of the 30th biggest day in the past 250 days. (If the Lookback Window is "250")
RANGE 2 nth (Blue lines):
* This number represents the range of the nth biggest day, week, or month in the Lookback Window
- Example: "10" would represent the range of the 10th biggest day in the past 250 days. (If the Lookback Window is "250")
RANGE 3 nth (Pink lines):
* This number represents the range of the nth biggest day, week, or month in the Lookback Window
- Example: "3" would represent the range of the 3rd biggest day in the past 250 days. (If the Lookback Window is "250")
YELLOW LINES:
* The yellow lines are the average percentage move of the inputted number in the Lookback Window
SUGGESTED INPUTS:
FOR DAILY:
Lookback Window: 250
Range 1 nth: 30
Range 2 nth: 10
Range 3 nth: 3
FOR WEEKLY:
Lookback Window: 50
Range 1 nth: 10
Range 2 nth: 5
Range 3 nth: 2
FOR MONTHLY:
Lookback Window: 12
Range 1 nth: 3
Range 2 nth: 2
Range 3 nth: 1
TIMEFRAMES TO USE (If You Have TradingView Premium):
Daily: 5 minute timeframe and higher (15 minute timeframe and higher for Futures)
Weekly: 15 minute timeframe and higher
Monthly: Daily timeframe and higher (Monthly still has issues)
TIMEFRAMES TO USE (If You DO NOT Have TradingView Premium):
Daily: 15 minute timeframe and higher
Weekly: 30 minute timeframe and higher
Monthly: Daily timeframe and higher (Monthly still has issues)
IMPORTANT RELATED NOTE:
If you decide to use a higher Lookback Window, the ranges might be off and the timeframes listed above might not apply
ISSUES THAT MIGHT BE RESOLVED IN THE FUTURE
1. If it is a shortened week (No Monday or Friday), then the Weekly Ranges will show the same ranges as last week
2. Monthly ranges will change based on any timeframe used
Информация о релизе
Ranges plot update (had to "offset = -1")Скрипт с открытым кодом
В истинном духе TradingView автор этого скрипта опубликовал его с открытым исходным кодом, чтобы трейдеры могли понять, как он работает, и проверить на практике. Вы можете воспользоваться им бесплатно, но повторное использование этого кода в публикации регулируется Правилами поведения. Вы можете добавить этот скрипт в избранное и использовать его на графике.
Отказ от ответственности
Все виды контента, которые вы можете увидеть на TradingView, не являются финансовыми, инвестиционными, торговыми или любыми другими рекомендациями. Мы не предоставляем советы по покупке и продаже активов. Подробнее — в Условиях использования TradingView.