OPEN-SOURCE SCRIPT
Retail Sales v Inflation YoY
Обновлено
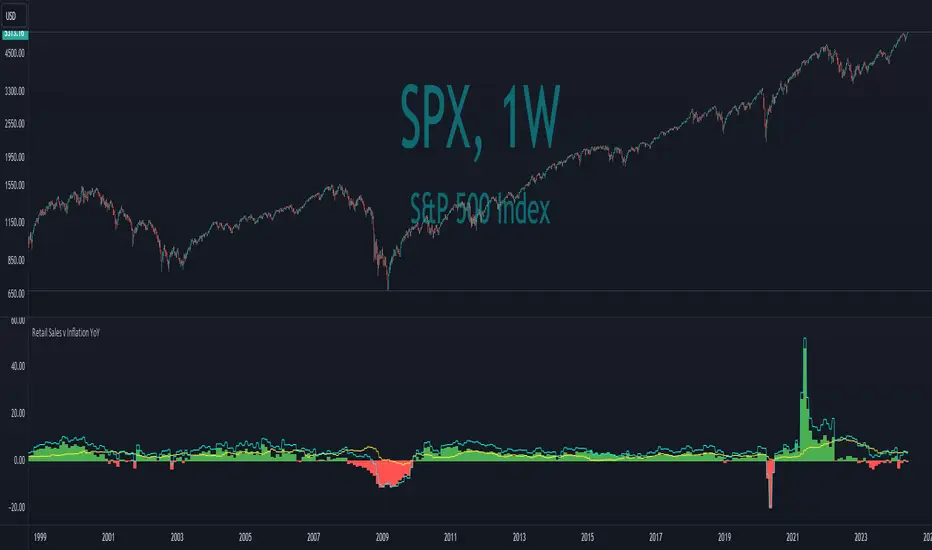
Are high retail sales increases really positive if the inflation rate is higher?
This year over year indicator of retail sales versus inflation levels can be placed in concert with any security to determine how symbols trade when inflation or retail sales are higher. A green histogram is when retail sales are higher than the inflation rate on a year over year basis. Red indicates inflation is higher rate.
The indicator can work with any symbols to see divergences. Feel free to change the positive and negative symbols to run other comparisons.
Информация о релизе
The user can adjust the timeframes if using this to compare non-monthly symbols. The default if comparing Retail Sales and Inflation should remain on a monthly timeframe but other granular comparisons can occur with any other symbols on timeframes of your choice.Скрипт с открытым кодом
В истинном духе TradingView автор этого скрипта опубликовал его с открытым исходным кодом, чтобы трейдеры могли понять, как он работает, и проверить на практике. Вы можете воспользоваться им бесплатно, но повторное использование этого кода в публикации регулируется Правилами поведения. Вы можете добавить этот скрипт в избранное и использовать его на графике.
All forecasts are based on analysis of past behavior. Prior movements are not always indicative of future movement. Develop the theory, test the theory. Do your own research. Nothing in this analysis constitutes advice. YouTube For More. Good luck!!
Отказ от ответственности
Все виды контента, которые вы можете увидеть на TradingView, не являются финансовыми, инвестиционными, торговыми или любыми другими рекомендациями. Мы не предоставляем советы по покупке и продаже активов. Подробнее — в Условиях использования TradingView.