OPEN-SOURCE SCRIPT
EMA deviation & Range with barcolor change
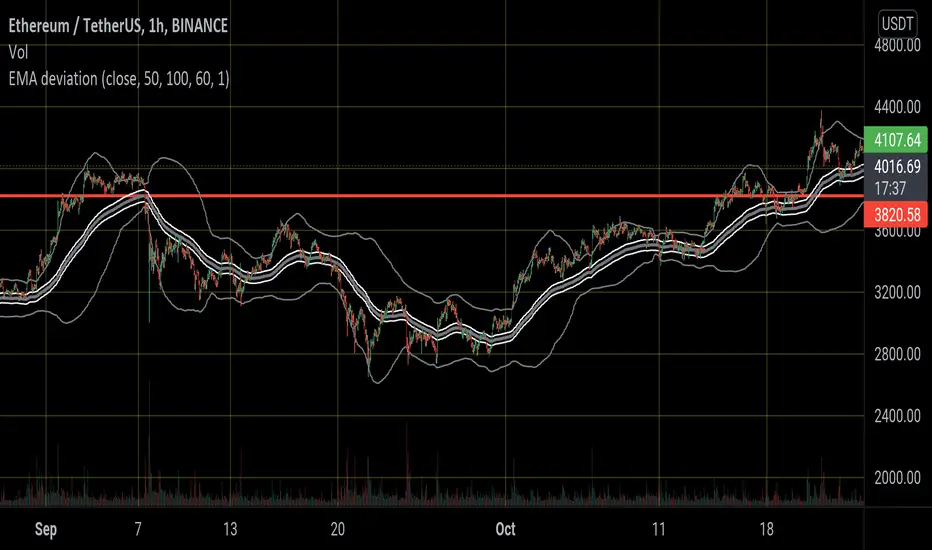
This indicator includes an EMA, a range and outer lines similar to the Bollinger Bands, but with a different calculation (which also becomes apparent once you compare the two). This indicator fits very well with the EMA pullback strategy.
The color of the candles changes depending on where it is located.
Above the EMA - green
Below it - red
Inside the range - black
All colors as well as lines are customizable under the Style tab.
The "Deviation" can be set to 0, here there are only slight deviations.
The EMA range can be adjusted in 0.1 steps to achieve the highest possible accuracy of the pullbacks.
If you have any questions, please don't hesitate to contact me.
Скрипт с открытым кодом
В истинном духе TradingView автор этого скрипта опубликовал его с открытым исходным кодом, чтобы трейдеры могли понять, как он работает, и проверить на практике. Вы можете воспользоваться им бесплатно, но повторное использование этого кода в публикации регулируется Правилами поведения. Вы можете добавить этот скрипт в избранное и использовать его на графике.
Отказ от ответственности
Все виды контента, которые вы можете увидеть на TradingView, не являются финансовыми, инвестиционными, торговыми или любыми другими рекомендациями. Мы не предоставляем советы по покупке и продаже активов. Подробнее — в Условиях использования TradingView.