OPEN-SOURCE SCRIPT
HL-Average
Обновлено
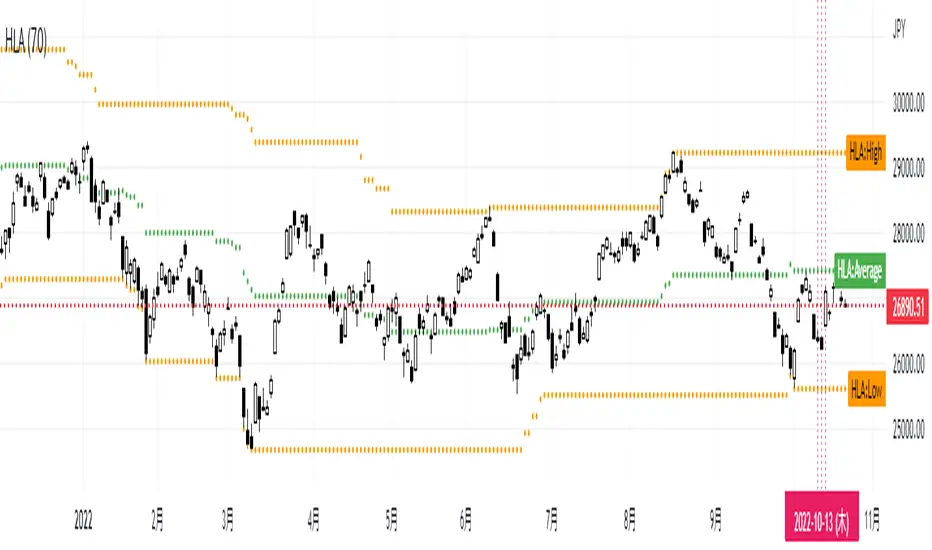
This script extracts the highest price "ta.highest" and lowest price "ta.lowest" over a period of time, obtains the average value "array.avg" and plots it on a chart. At the same time, it also plots high and low prices, so you can use the volatility over a period of time and its center point as a reference for trading. The pine code is as simple as possible, so there is no difficulty. You can also change the period. We sincerely hope that this script will help you in your trading.
Информация о релизе
This script extracts the highest price "ta.highest" and lowest price "ta.lowest" over a period of time, obtains the average value "array.avg" and plots it on a chart. At the same time, it also plots high and low prices, so you can use the volatility over a period of time and its center point as a reference for trading. The pine code is as simple as possible, so there is no difficulty. You can also change the period. We sincerely hope that this script will help you in your trading.Скрипт с открытым кодом
В истинном духе TradingView автор этого скрипта опубликовал его с открытым исходным кодом, чтобы трейдеры могли понять, как он работает, и проверить на практике. Вы можете воспользоваться им бесплатно, но повторное использование этого кода в публикации регулируется Правилами поведения. Вы можете добавить этот скрипт в избранное и использовать его на графике.
Отказ от ответственности
Все виды контента, которые вы можете увидеть на TradingView, не являются финансовыми, инвестиционными, торговыми или любыми другими рекомендациями. Мы не предоставляем советы по покупке и продаже активов. Подробнее — в Условиях использования TradingView.