OPEN-SOURCE SCRIPT
[MAD] Harmonic Wave Fourier Analysis
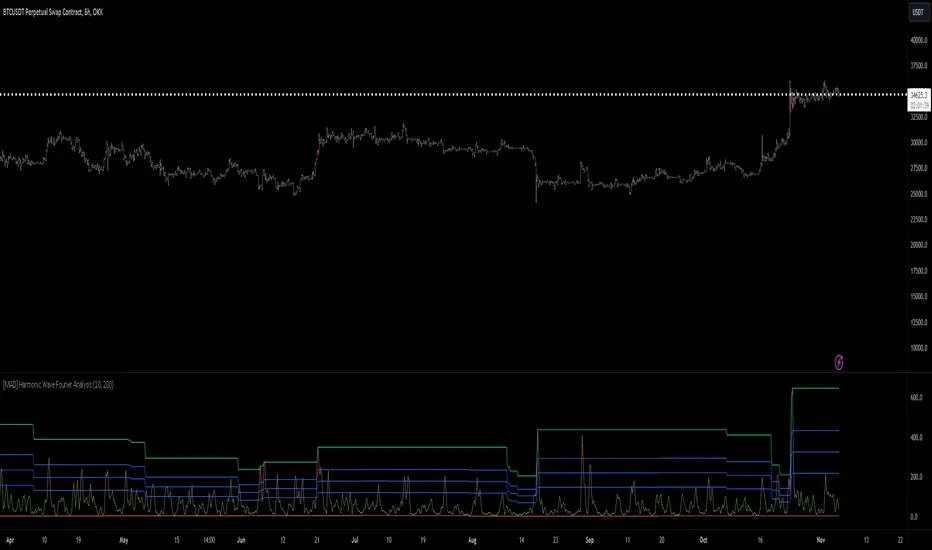
This script uses Fourier Analysis with additional postcalculations to draw a plot which displays the Amplitude-Change of the Fouriers
Parameter Settings:
You can set the number of data points to analyze
the period to check for extremes.
Fourier Transform: The script breaks down the time series data into its frequency components using cosine and sine calculations.
Harmonic Analysis: It calculates the strength and phase of each frequency component, producing harmonic waves.
Amplitude Change: It determines the change in amplitude between peaks and troughs for each harmonic.
Latest Value Extraction: The script selects the middle amplitude change as the latest data point.
High/Low Points: Finds the maximum and minimum amplitude changes over a specified period.
Visualization: It plots the latest amplitude change with a color that indicates its value relative to the identified extremes.
splitted by 3 Blue plots (1/3 1/2 2/3 from min to max)
How to trade?
May go for retests to the blue lines after big moves.
See this script as braindump of an idea, so its just a concept :-)
Скрипт с открытым кодом
В истинном духе TradingView автор этого скрипта опубликовал его с открытым исходным кодом, чтобы трейдеры могли понять, как он работает, и проверить на практике. Вы можете воспользоваться им бесплатно, но повторное использование этого кода в публикации регулируется Правилами поведения. Вы можете добавить этот скрипт в избранное и использовать его на графике.
Отказ от ответственности
Все виды контента, которые вы можете увидеть на TradingView, не являются финансовыми, инвестиционными, торговыми или любыми другими рекомендациями. Мы не предоставляем советы по покупке и продаже активов. Подробнее — в Условиях использования TradingView.