PROTECTED SOURCE SCRIPT
(FireflyTA) BB Pressure Heatmap
Обновлено
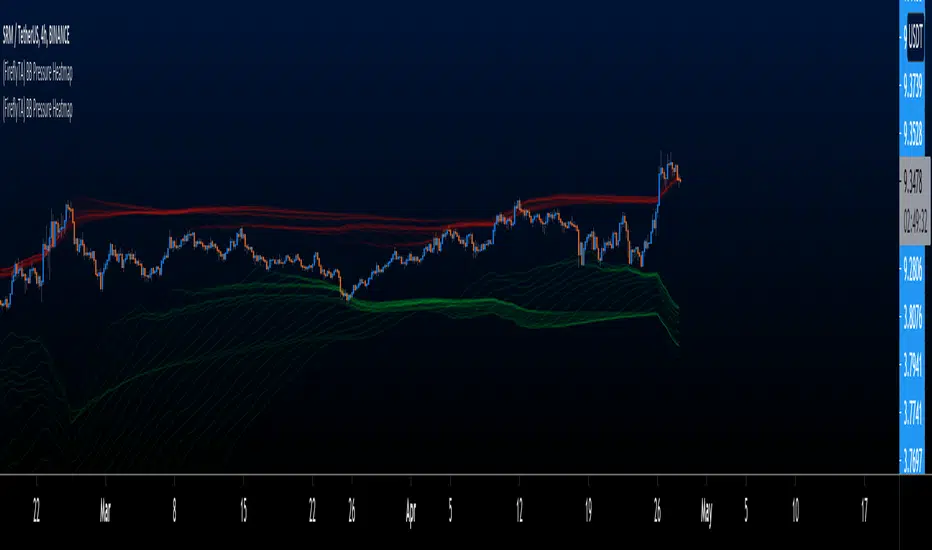
This is a simple heatmap based on multi-timeframe Bollinger Bands to find range support & resistance . It makes dynamic confluence zones visible and can be used to add evidence to a thesis or as a basis for a custom range S&R trading strategy.
Colors are optimized for a dark chart layout.
There are currently 3 presets ( LTF , MTF, HTF) available in case you don't know how to customize the BB settings.
You need to add two of these to show support AND resistance at the same time.
Enjoy!
Colors are optimized for a dark chart layout.
There are currently 3 presets ( LTF , MTF, HTF) available in case you don't know how to customize the BB settings.
You need to add two of these to show support AND resistance at the same time.
Enjoy!
Информация о релизе
v1.1 - This version adds the possibility to alter the number of BBs used for the heatmap generation. This can reduce lags in case the default settings are too heavy on performance.
- There is also a new preset available for the 4H chart ("MTF 4H Lightweight")
Информация о релизе
Update v1.2- By checking "Use Current Chart" you can now always use the indicator with the chart you're on. The input field below lets you add a ticker, so it's possible to fetch data from a different chart.
- Optimized some values and the colorization.
Crypto TA & FireflyTA indicator tutorials:
Twitter: twitter.com/FireflyTA
YouTube: youtube.com/channel/UC3Hxf0omt3dMqAxGQBnXJPA
Discord: t.co/Ky7gE7zfja
Twitch: twitch.tv/fireflyta
Twitter: twitter.com/FireflyTA
YouTube: youtube.com/channel/UC3Hxf0omt3dMqAxGQBnXJPA
Discord: t.co/Ky7gE7zfja
Twitch: twitch.tv/fireflyta
Отказ от ответственности
Все виды контента, которые вы можете увидеть на TradingView, не являются финансовыми, инвестиционными, торговыми или любыми другими рекомендациями. Мы не предоставляем советы по покупке и продаже активов. Подробнее — в Условиях использования TradingView.