OPEN-SOURCE SCRIPT
SPX and Federal Net Liquidity difference
Обновлено
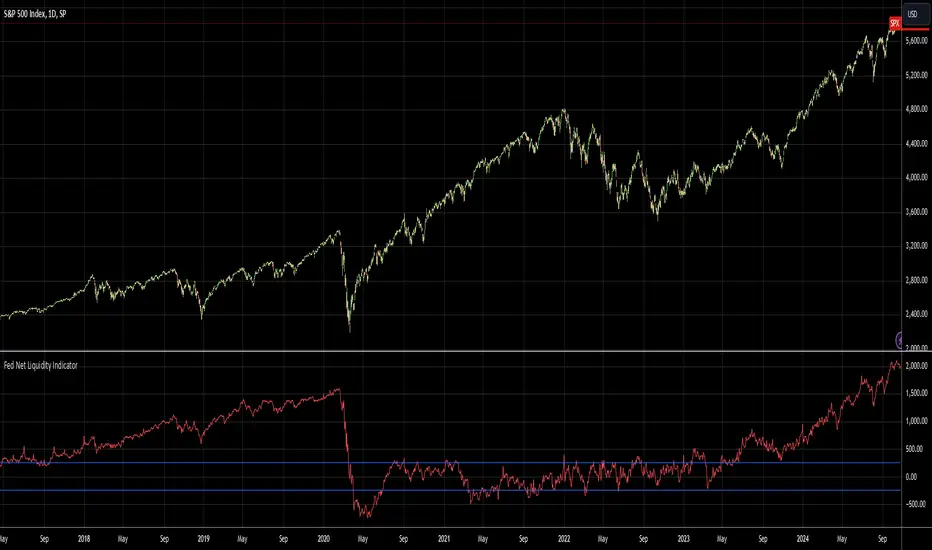
Script for applying Federal Net Liquidity to the SPX post-2020 monetary policy. Original indicator from jlb05013 with adjustments to make it more readable and usable. When the indicator is above 250 the SPX is overbought and when it's below -250 the SPX is oversold.
It's not perfect, I'm just publishing because I didn't see it already out there.
It's not perfect, I'm just publishing because I didn't see it already out there.
Информация о релизе
TradingView was bringing in the variables with different units. Fixed that and removed unnecessary code.Информация о релизе
Reconnected FRED dataset for Federal Balance Sheet. The quandl dataset was not working anymore.Indicator now clearly shows either a) a strong over-valuation in the market or b) the indicator no longer applies
Скрипт с открытым кодом
В истинном духе TradingView автор этого скрипта опубликовал его с открытым исходным кодом, чтобы трейдеры могли понять, как он работает, и проверить на практике. Вы можете воспользоваться им бесплатно, но повторное использование этого кода в публикации регулируется Правилами поведения. Вы можете добавить этот скрипт в избранное и использовать его на графике.
Отказ от ответственности
Все виды контента, которые вы можете увидеть на TradingView, не являются финансовыми, инвестиционными, торговыми или любыми другими рекомендациями. Мы не предоставляем советы по покупке и продаже активов. Подробнее — в Условиях использования TradingView.